Pi in the sky: Launch 2
The second launch of the high-altitude balloon program, building on lessons learned to achieve better results.
Pi in the Sky is a student-led high-altitude balloon program combining engineering and physics to carry scientific payloads into the stratosphere. See the main project post for a general overview.
On 11/05/2025, the second Pi in the Sky launch took place, again launching from Thor Park ($50.994938^\circ\,\mathrm{N}$, $5.538705^\circ\,\mathrm{E}$). This launch incorporated improvements from the previous attempt, such as placing the GPS tracker outside the foil acting as a Faraday cage and lowering the APRS antenna to enhance signal reception.
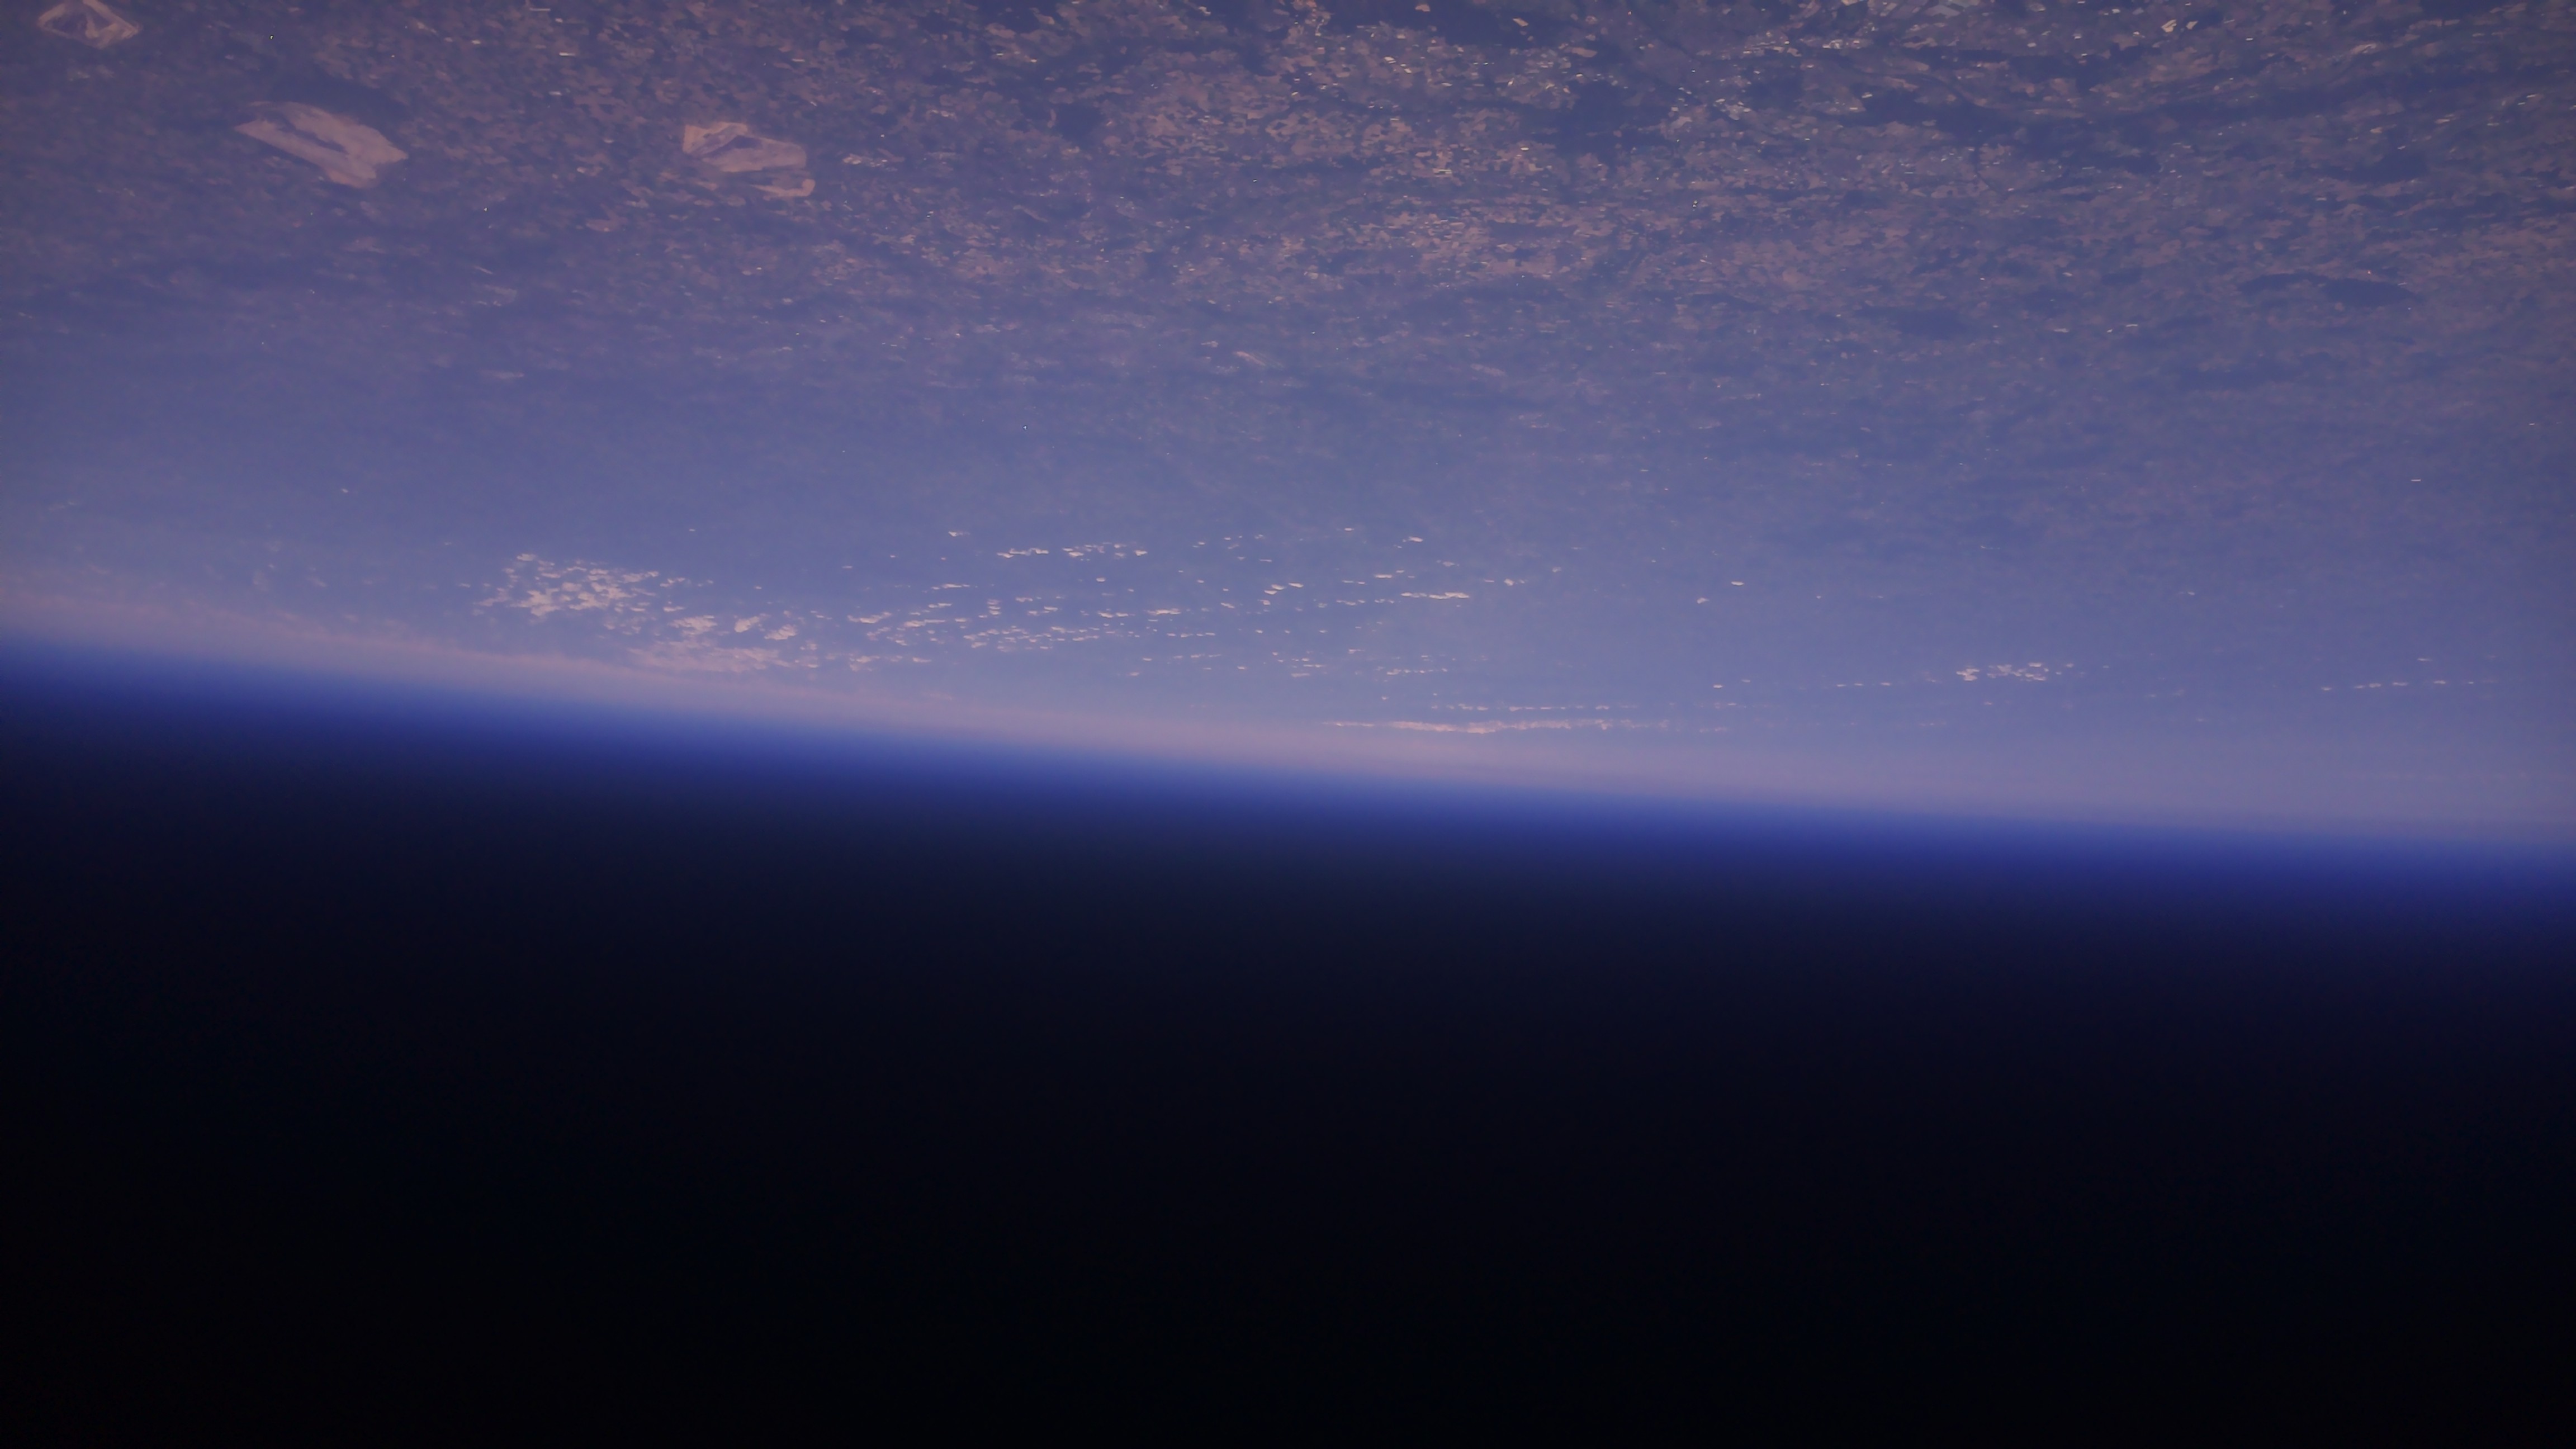
Like the previous launch, weather conditions were favorable, with mild winds and nearly clear blue skies. The launch occurred at roughly the same time as last time, around 11:00 LT. After a smooth ascent into the stratosphere, the balloon eventually descended and landed safely in the vicinity of Arendonk, Belgium, completing a successful flight and the experiments succeeded in generating data as well as taking beautiful images of our planet.
Slideshow
With the help of volunteers and the team, the balloon was safely released under great applause. As we managed to fix the Raspberry Pi camera system, it was able to capture beautiful pictures from our Earth from lift-off to touchdown. Click on the video below to see the slideshow and view the images taken by the gondola.
Results
As the gondola and experiments are once again successfully recovered, we are pleased to present our findings. The measurements provide a detailed profile of atmospheric conditions and UV spectra from the surface up to an altitude of approximately $36\,\mathrm{km}$.
Atmospheric pressure
The atmospheric pressure was measured at a lowered interval of $500\,\mathrm{ms}$ and synchronized with the local time of the launch. At the peak of the flight, a pressure of $10.63 \, \mathrm{hPa}$ was recorded. This is considered a low vacuum, although it remains several orders of magnitude higher than pressures typically achieved in laboratory vacuum chambers.
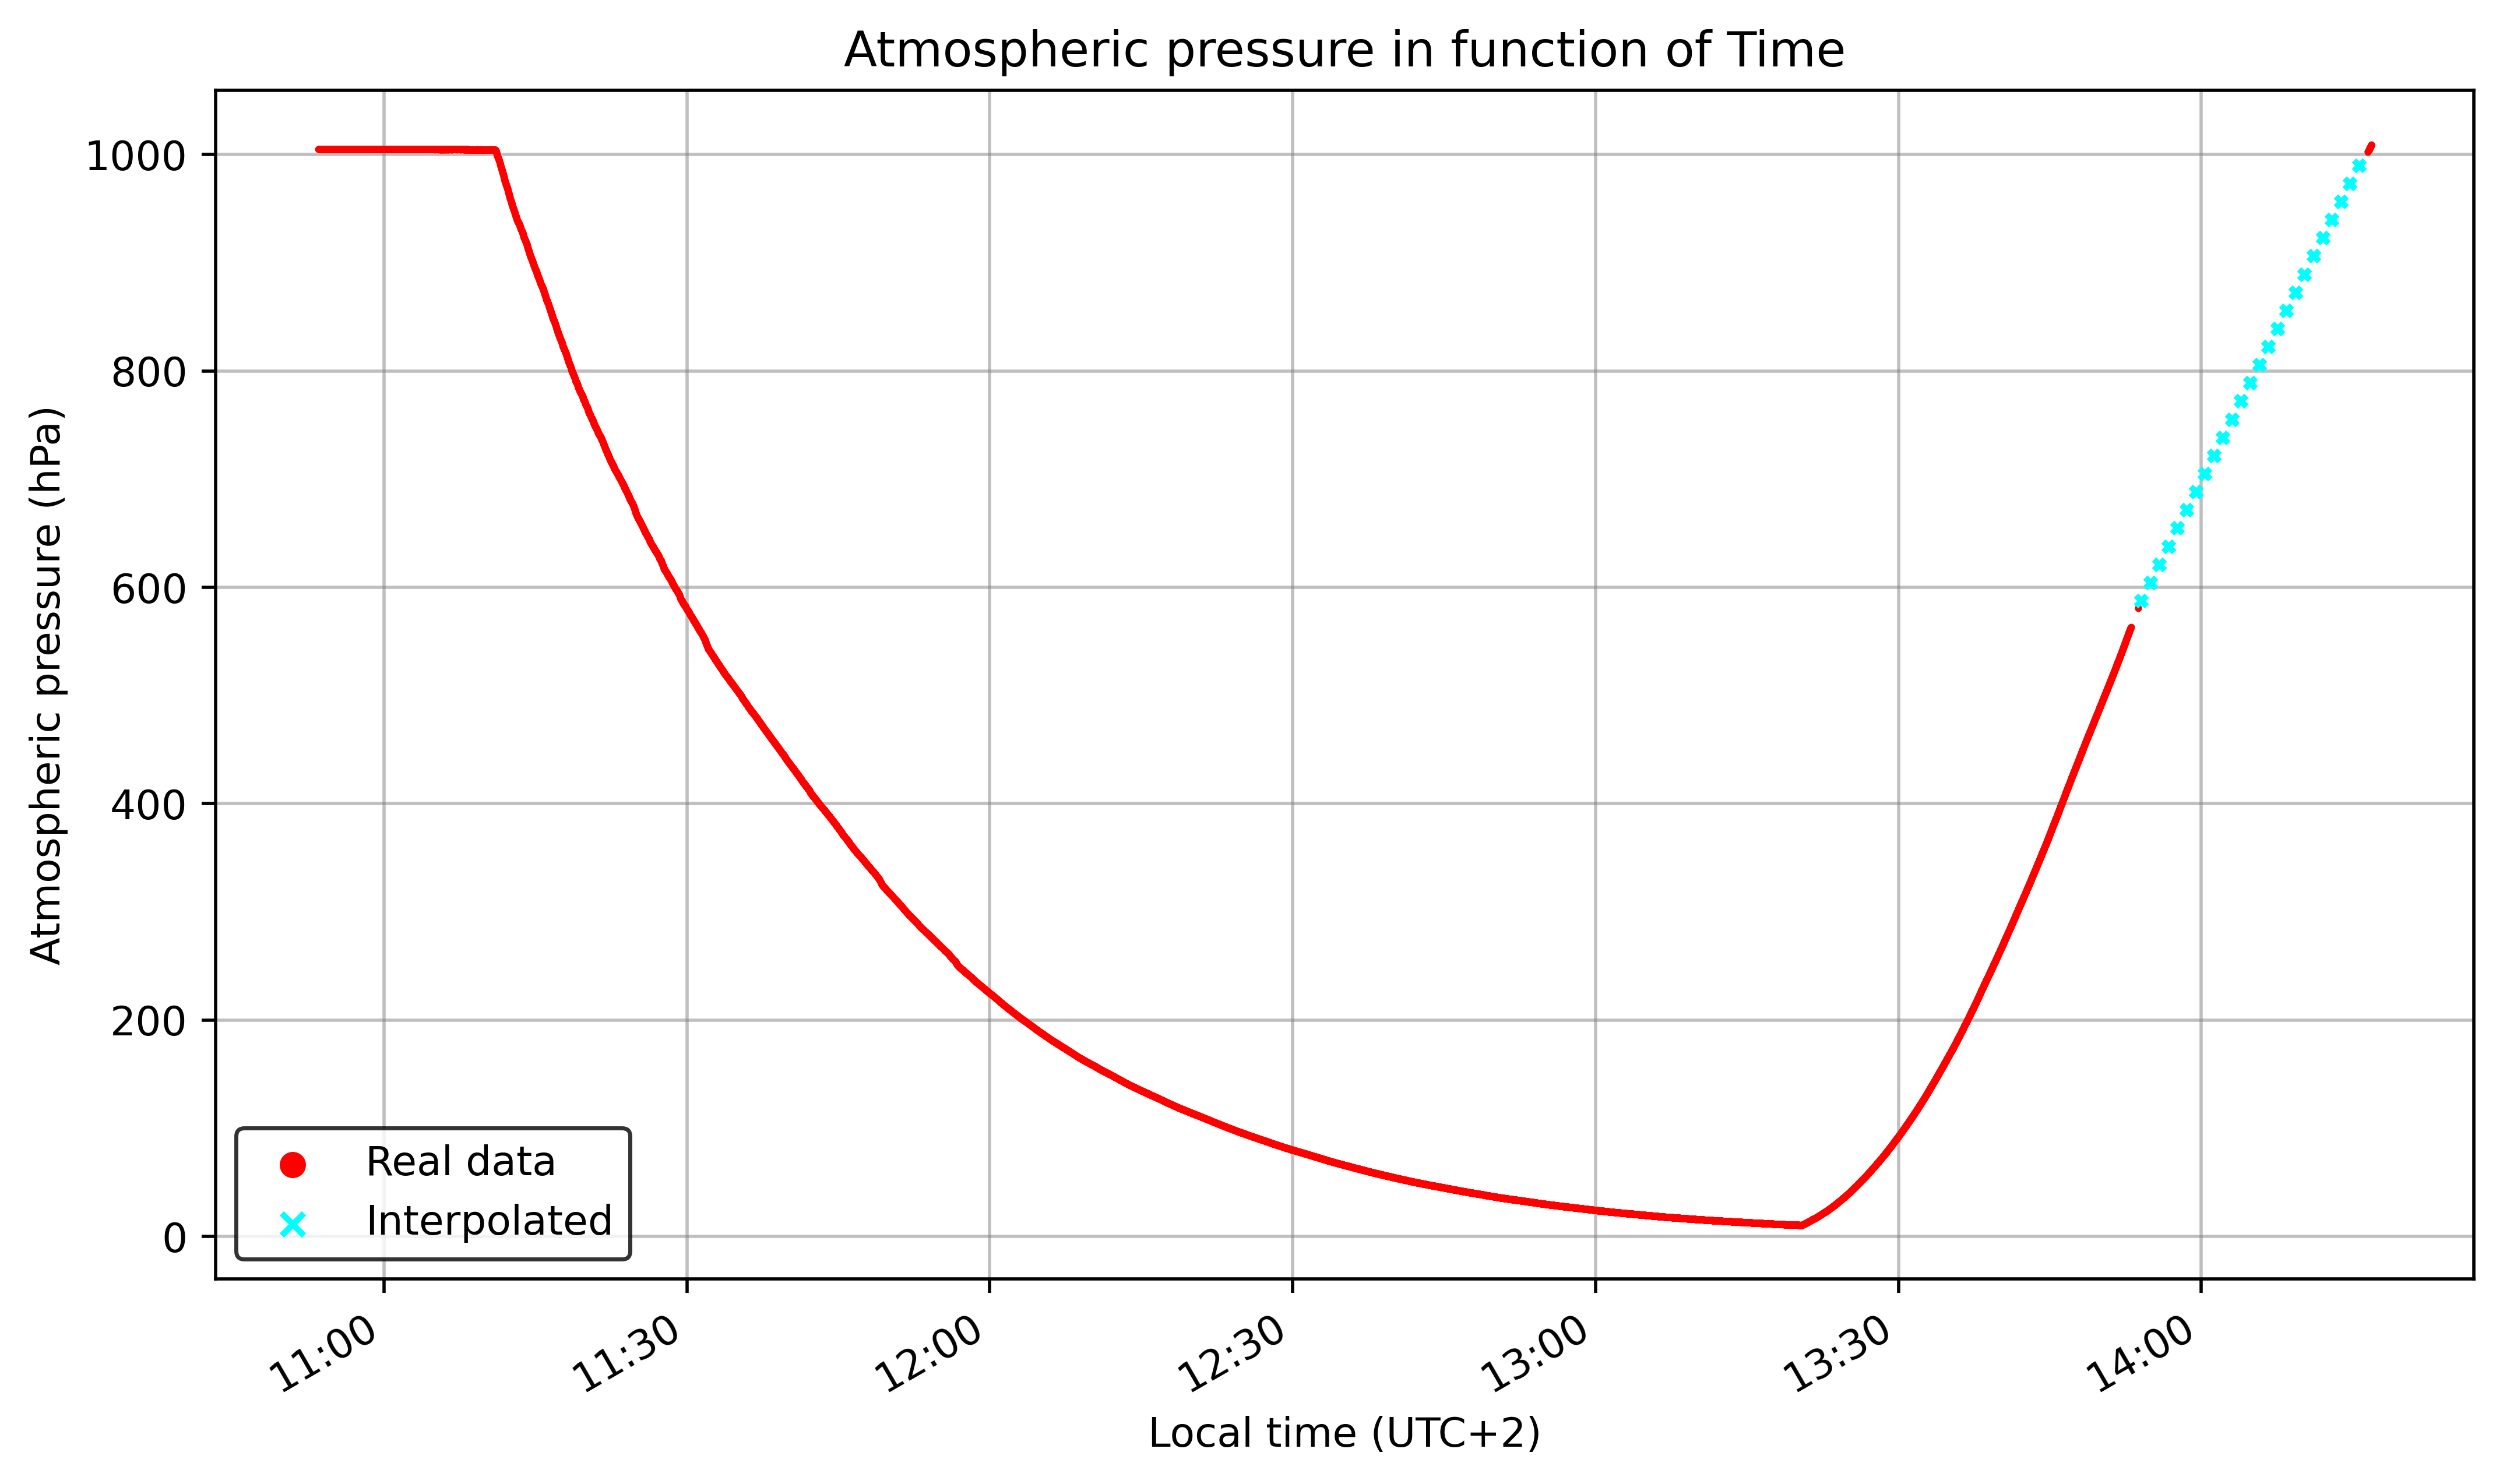

During the descent phase a portion of the pressure readings were corrupted, the missing values have been linearly interpolated and will be clearly denoted with crosses in following graphs.
Altitude vs Time
Using the following formula derived in the first launch post, the altitude of the balloon can be calculated from the atmospheric pressure and outside temperature measured in flight.
\[h' = h_0 + \frac{R \, T}{g \, M} \, \ln\!\left(\frac{P_0}{P}\right)\]with $P$ and $T$ as the atmospheric pressure and temperature at altitude, $P_0 = 1005.39 \,\text{hPa}\,$ as the sea-level pressure on 11/05/2025, $h_0 = 80 \,\text{m}$ as the sea-level altitude of the launch site, $g = 9.80665 \,\text{m/s}^2$ as the gravitational acceleration, $M = 0.0289644 \,\text{kg/mol}$ as the molar mass of air, and $R = 8.31432 \,\text{J/(mol·K)}$ as the universal gas constant.
Comparing the Altitude vs Time data of both launches, it can be seen that the first launch reached a higher altitude of $41.60 \,\mathrm{km}$, while the second launch reached around $36.13 \,\mathrm{km}$. This difference is most likely due to overfilling the balloon with Helium during the second attempt, increasing tension on the balloon. Both results are slightly above the manufacturer’s specified burst altitude range of $100\,000\,\mathrm{ft}$ to $\,110\,000 \mathrm{ft}$ ($\approx 30.48\,\mathrm{km}$ to $33.53 \,\mathrm{km}$), which is an added bonus, providing more measuring time for our experiments.
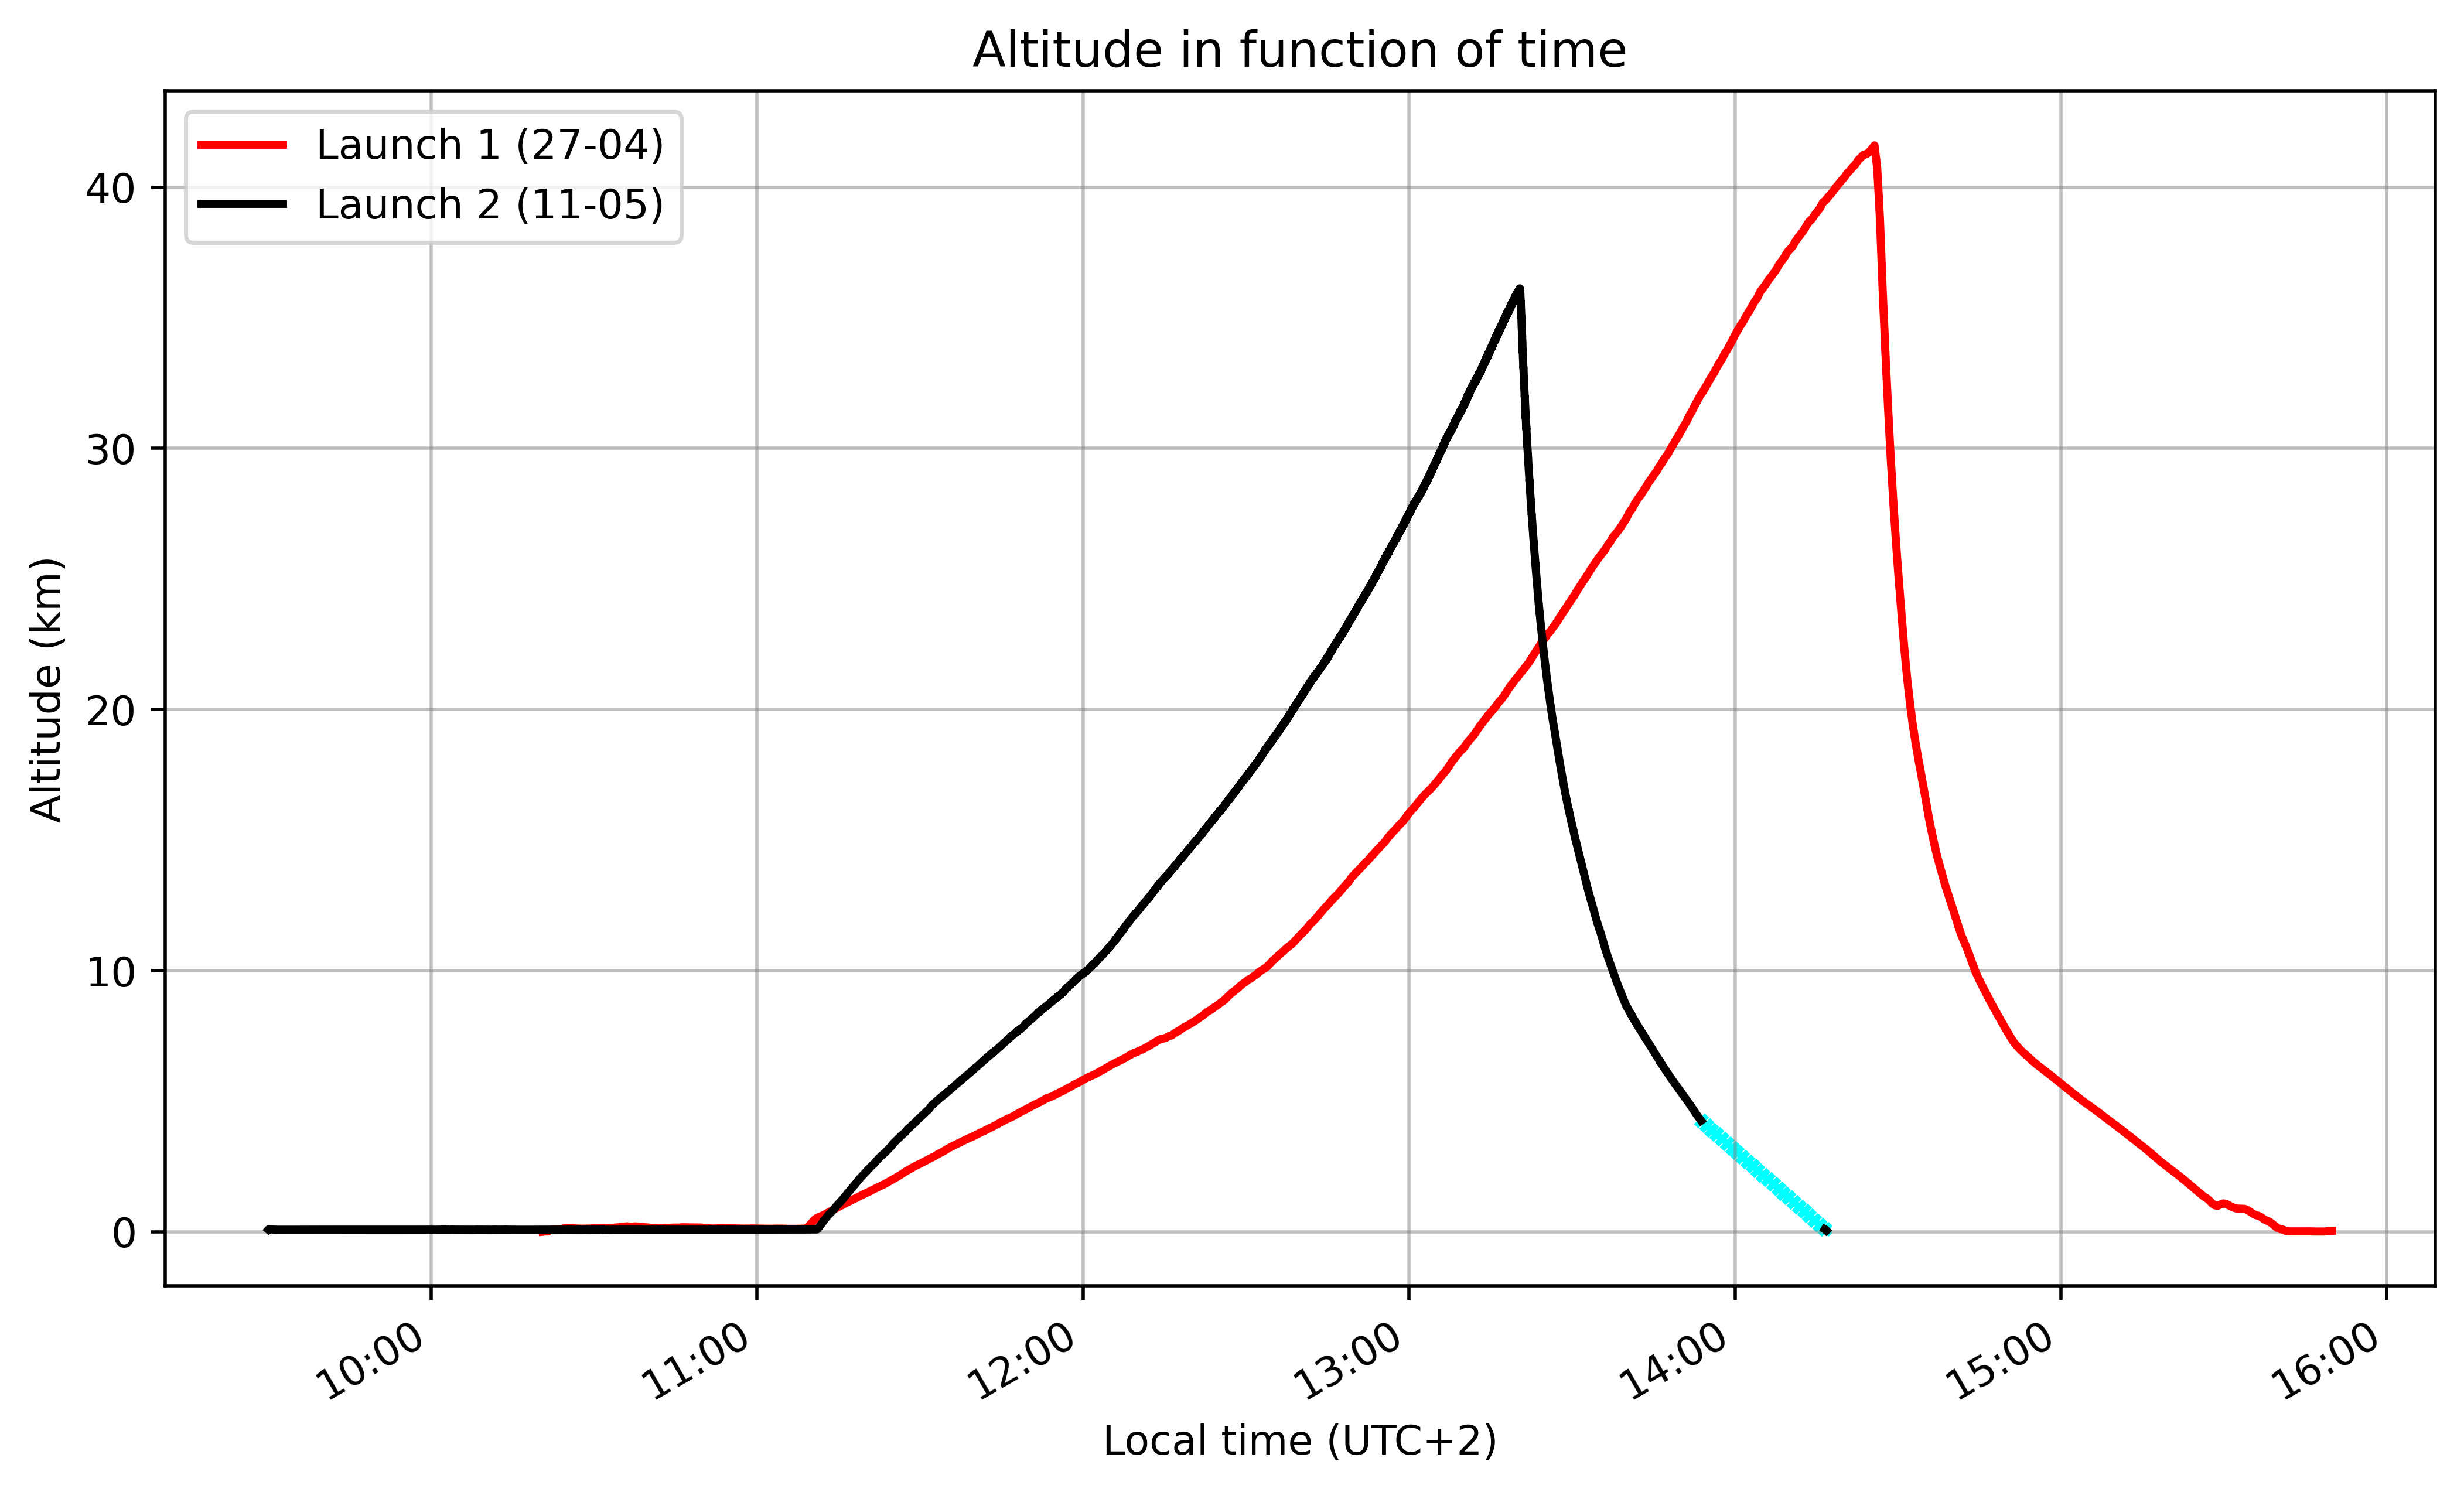

Cyan crosses mark data points where altitude was derived from interpolated pressure values.
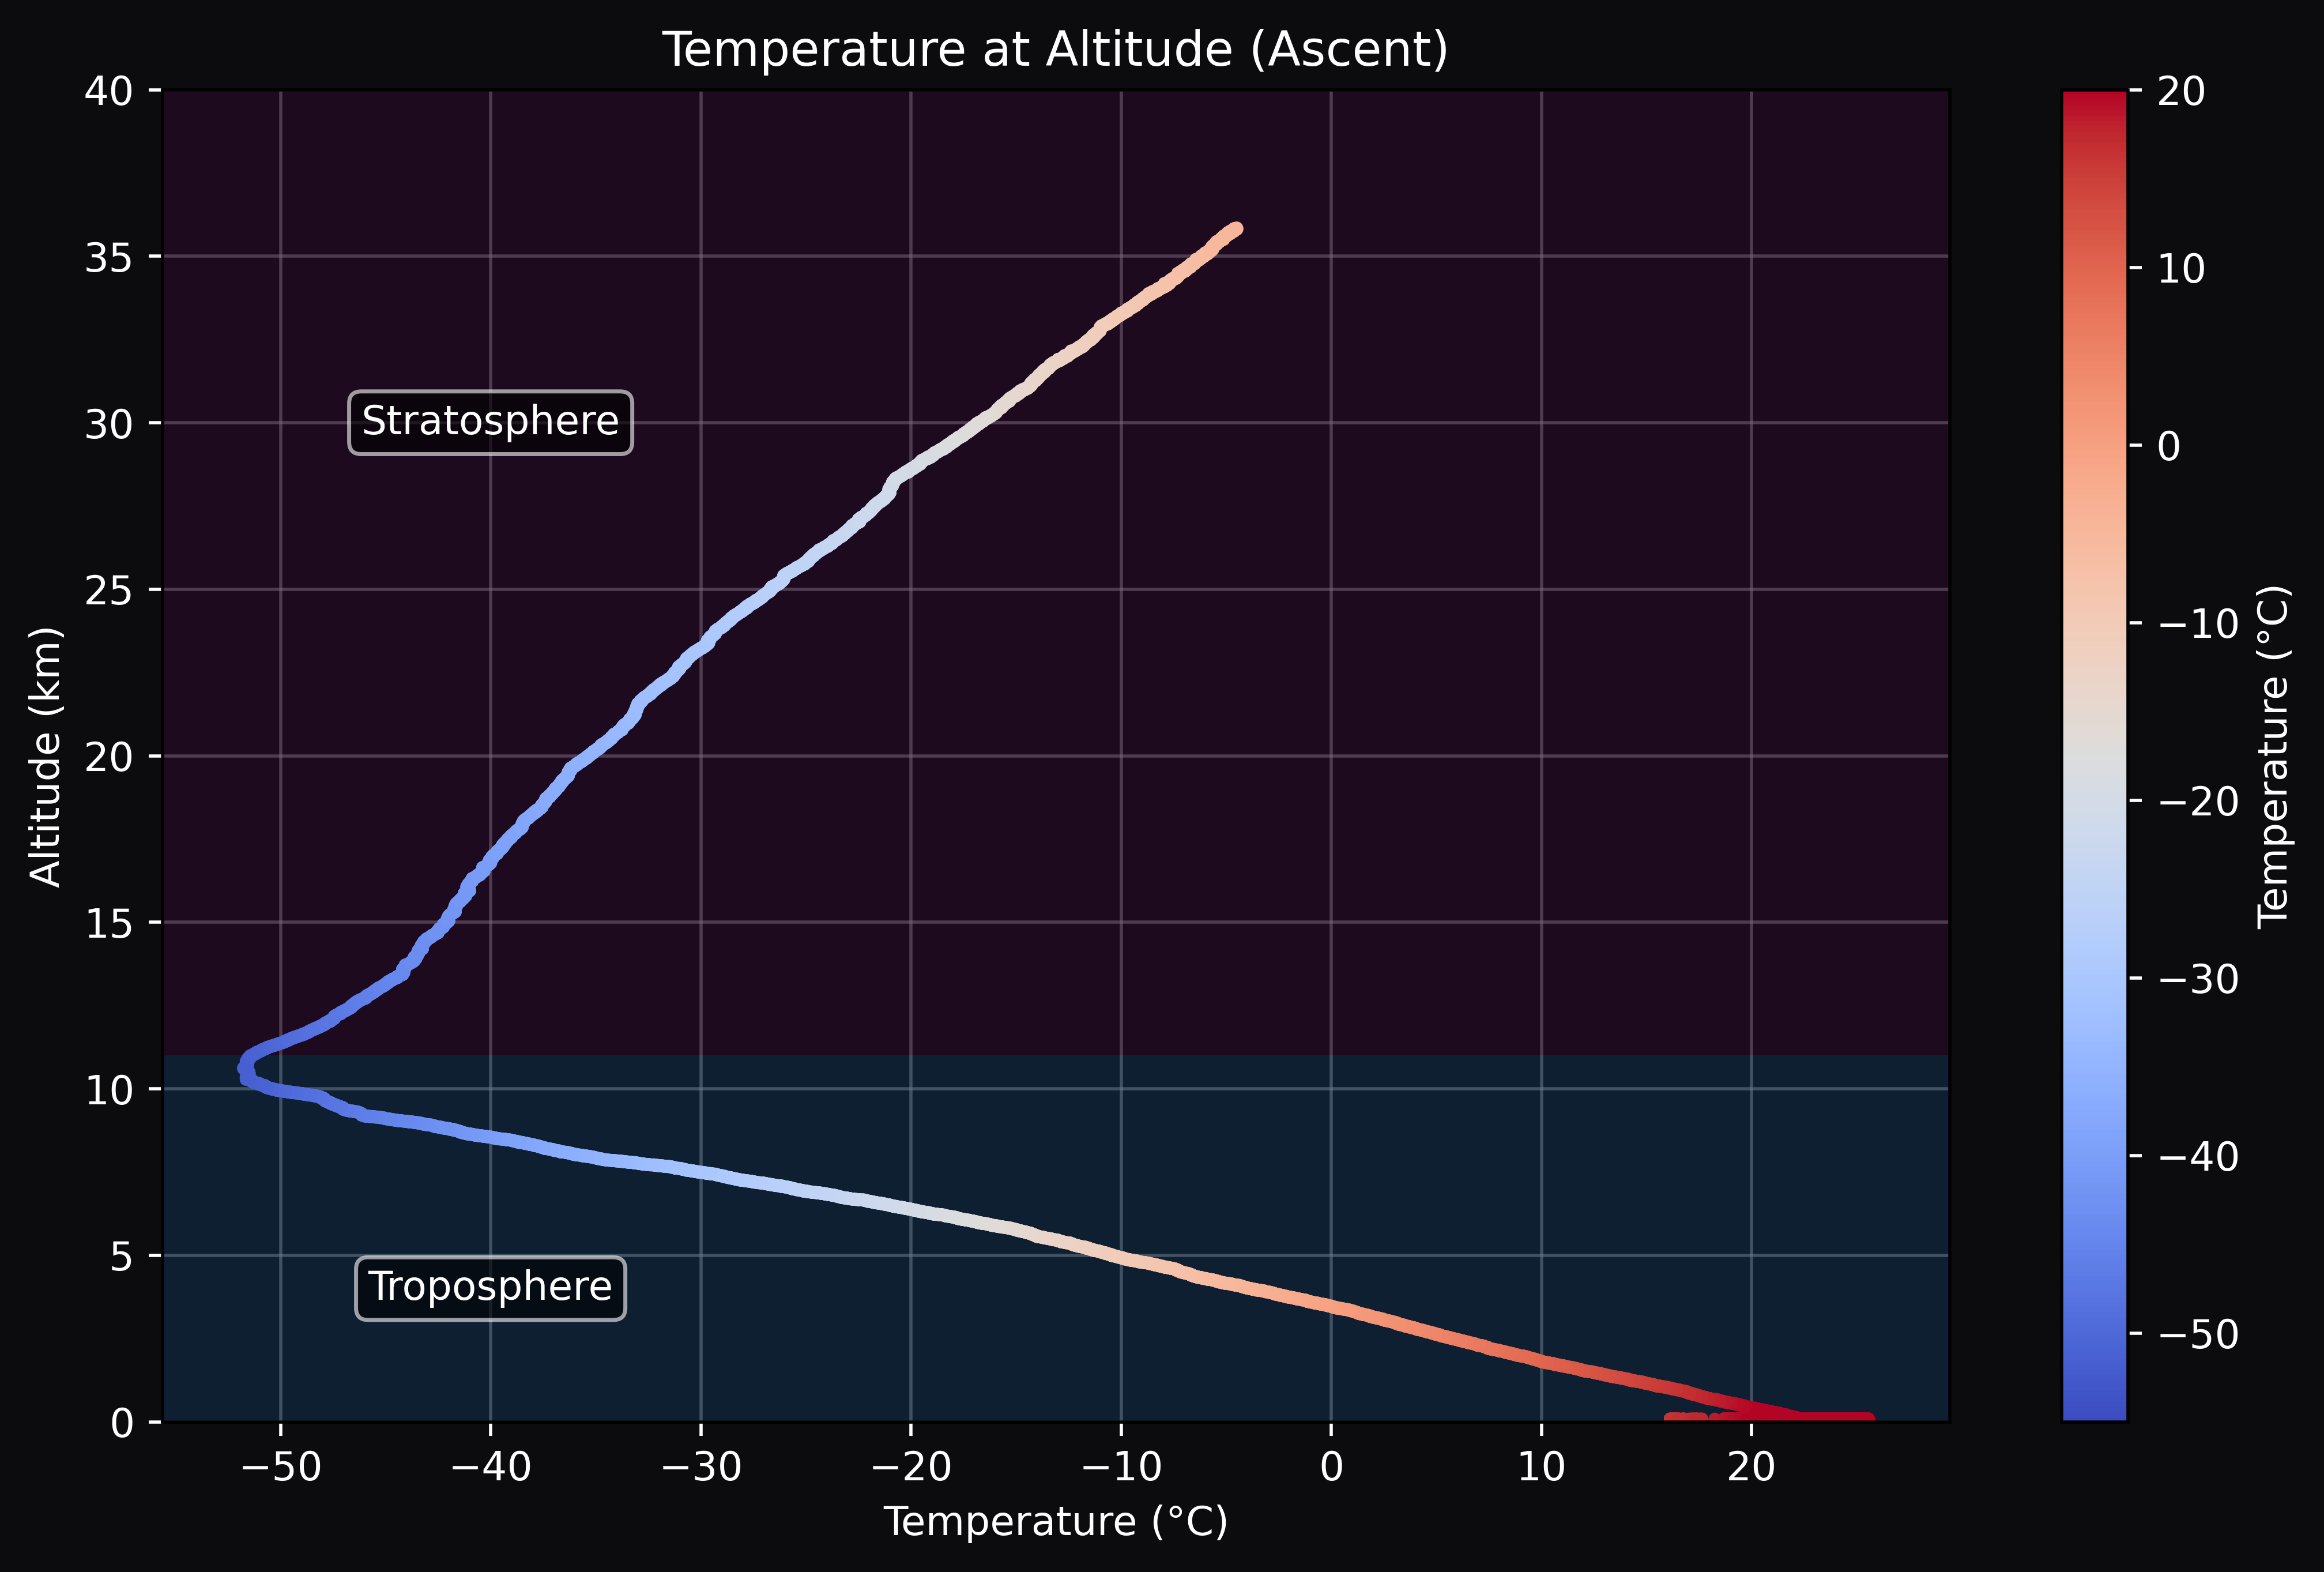
Temperature vs Altitude
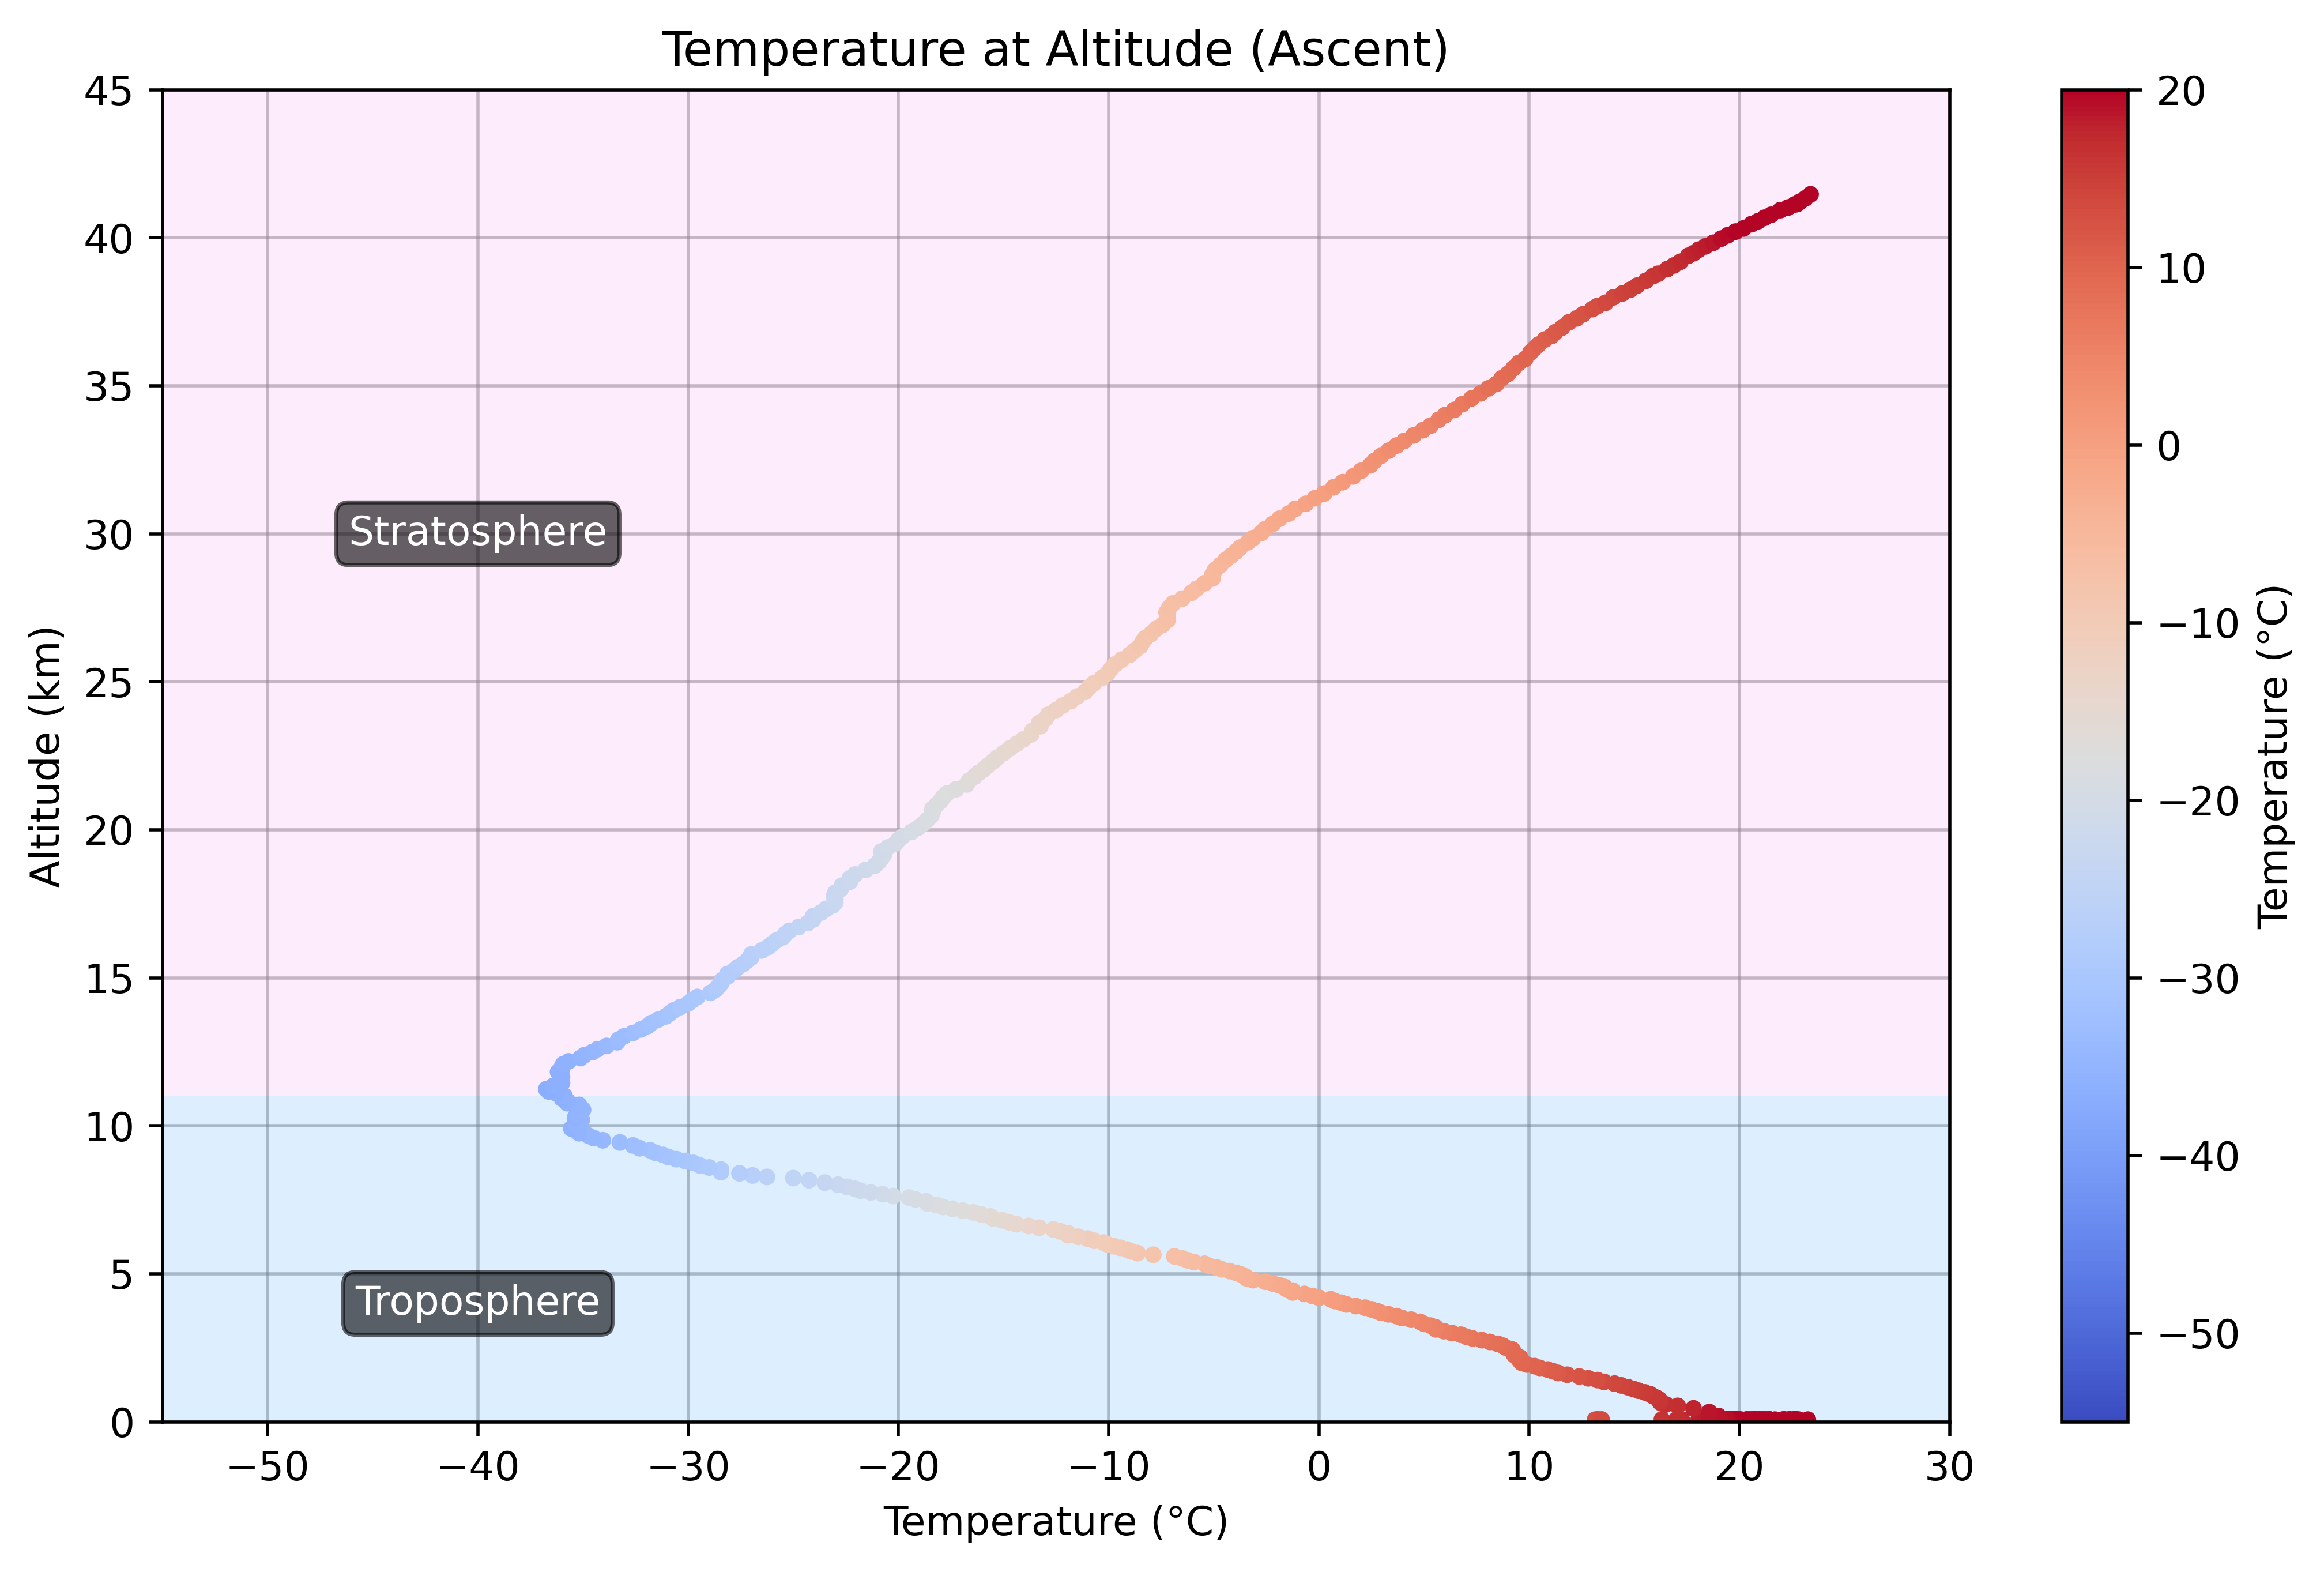
Plotting the outside temperature measurements in function of the altitude during the ascent phase shows a nearly inverse linear relation between temperature and altitude until an altitude of around $11 \,\mathrm{km}$ after which temperature starts increase again. This corresponds to the transition from troposphere to stratosphere.1 The lowest temperature measured during this mission was $−51.75\,^\circ\mathrm{C}$, while at the peak of the flight at $36.13 \,\mathrm{km}$ the temperature reached $-4.50\,^\circ\mathrm{C}$. This is $\approx 28\,^\circ\mathrm{C}$ colder than the temperature on the peak of the first launch.
Ascent rate vs Time
By computing the numerical derivative of the Altitude vs Time data, we obtain the Ascent rate vs Time graph. This clearly show three distinct phases of the mission: the ground phase, the ascent phase, and the descent phase. 
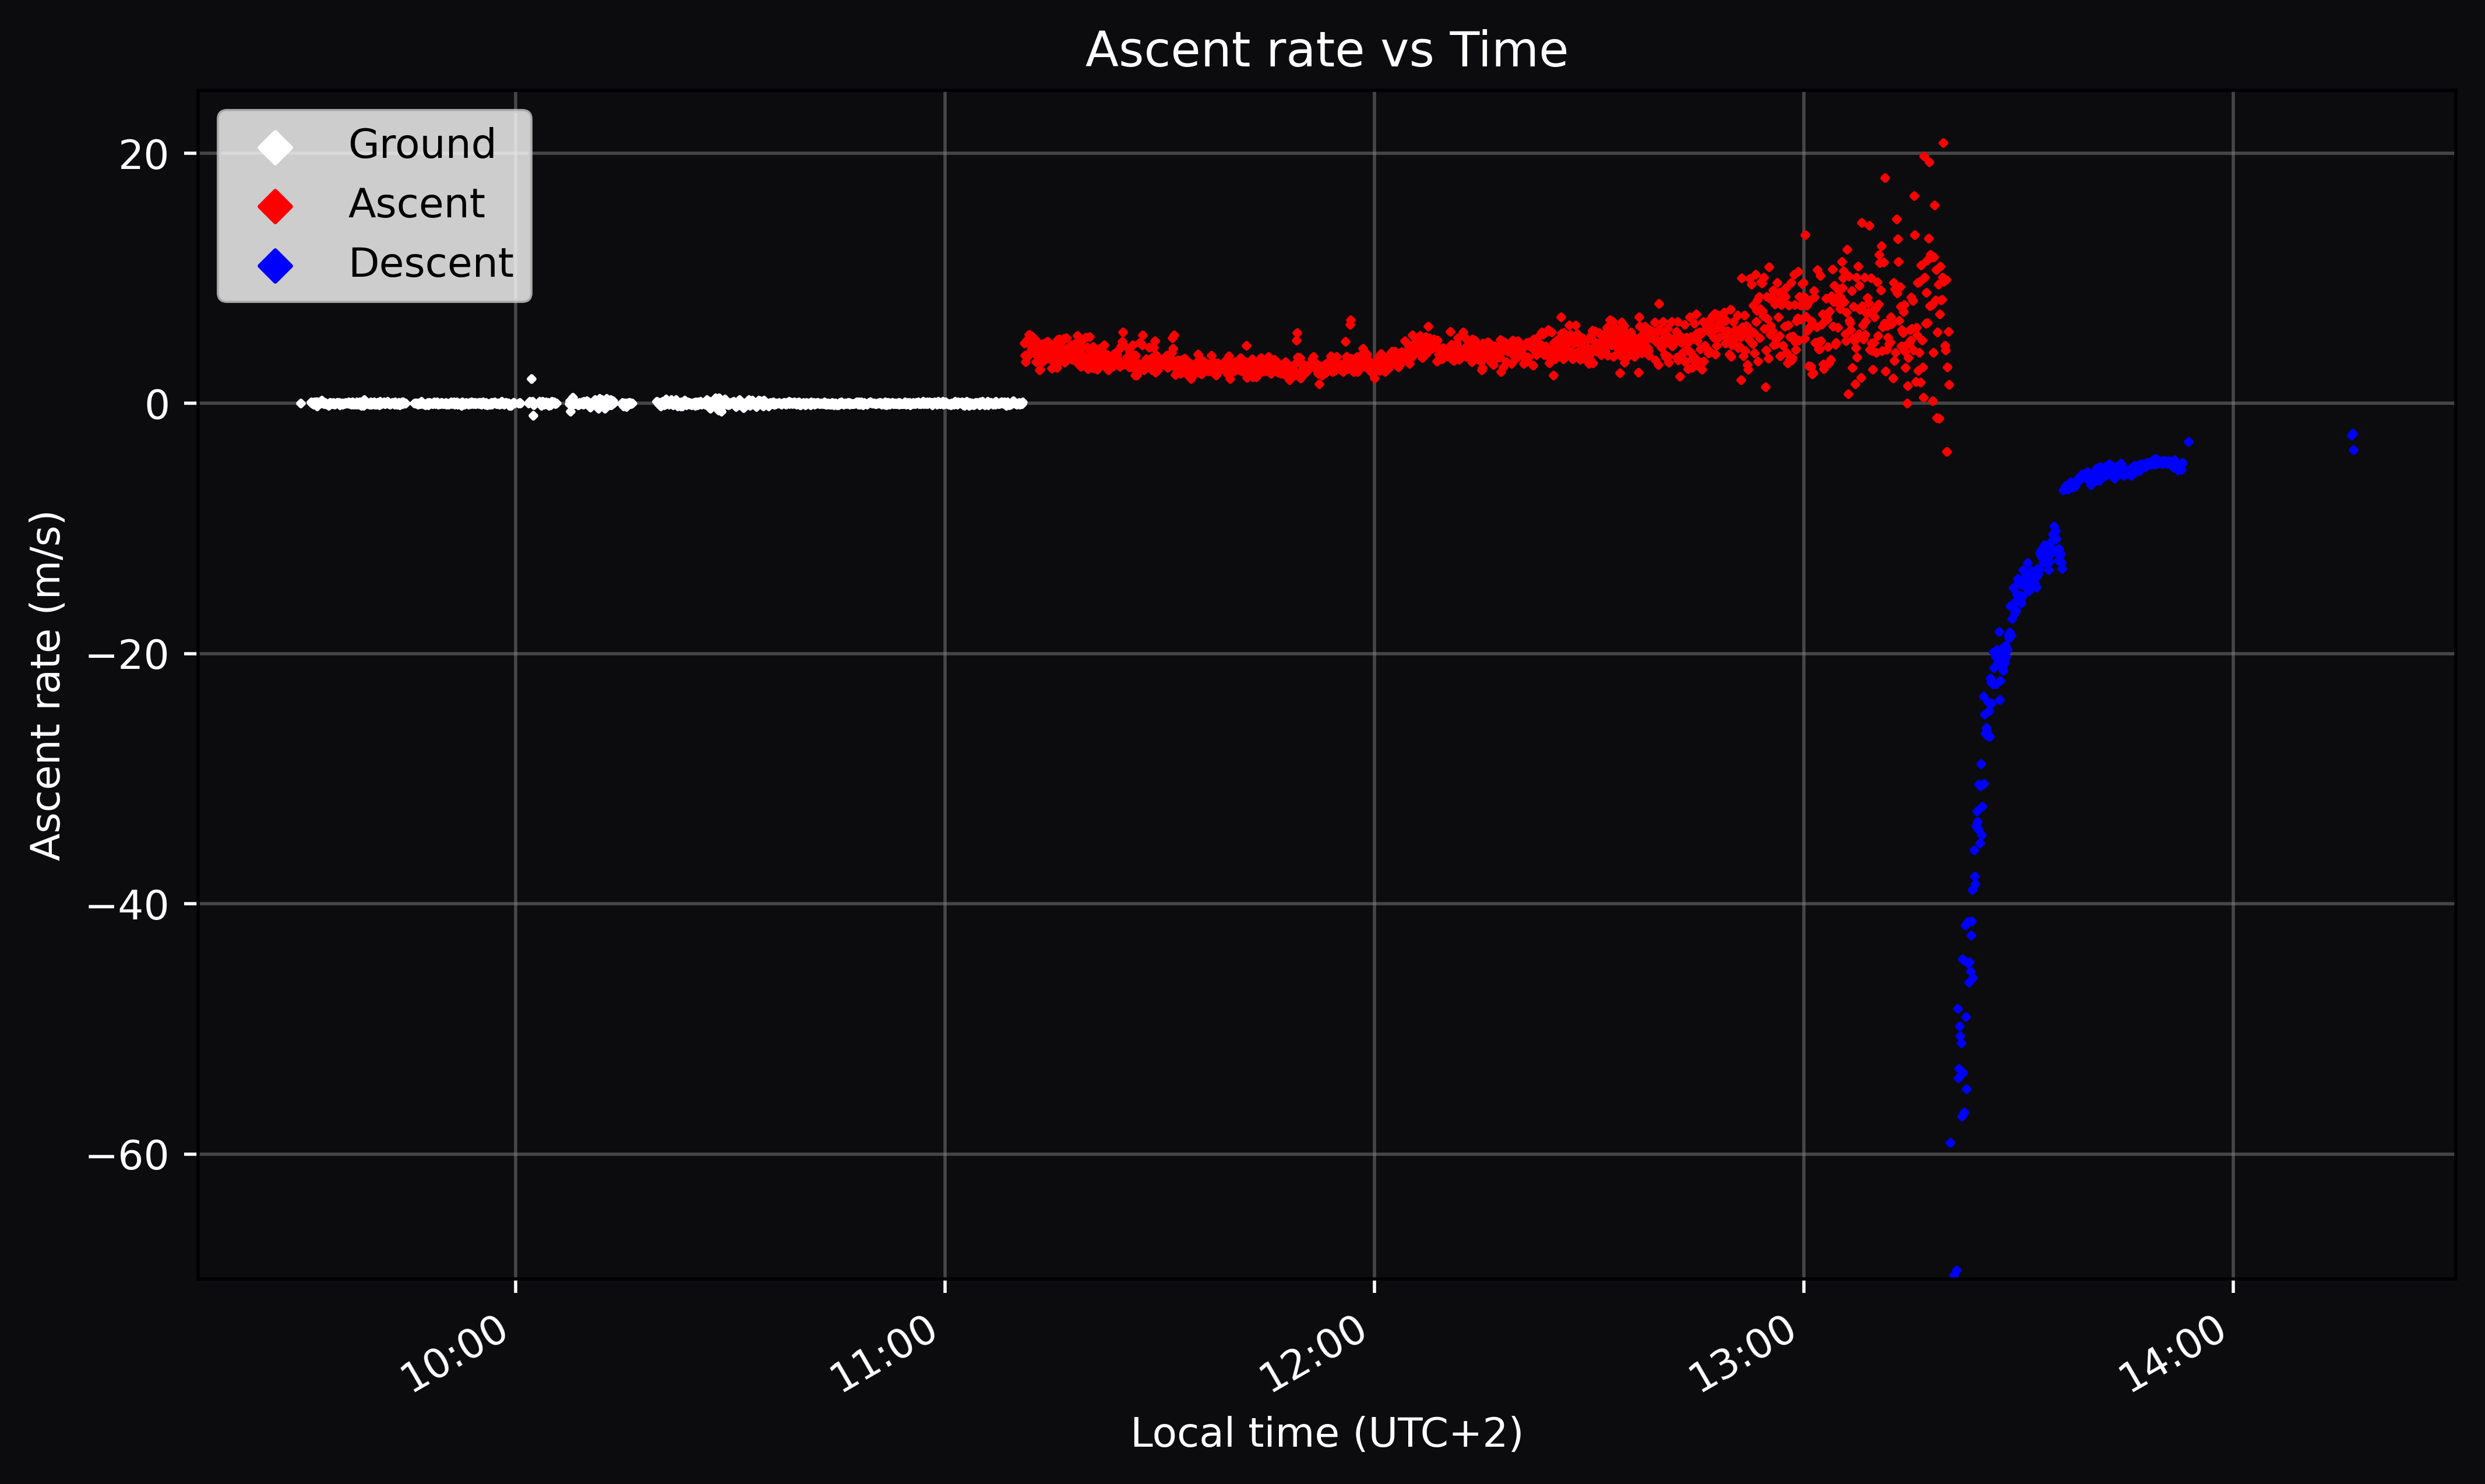 The mean ascent rate during the ascent phase was calculated as $\,4.642 \,\mathrm{m/s}$. Also note that the variability in the ascent rate increases as altitude increases. This could be caused by several factors, including changes in air density, wind gusts at higher altitudes, or minor variations in balloon shape and payload orientation during high level flight.
Looking at the descent phase, we see that the it quickly reaches an terminal velocity of $\approx 74\,\mathrm{m/s}$ just after the peak altitude and then continuously decreasing to a steady descent rate of $\approx 5.5\,\mathrm{m/s}$ as the gondola passes through denser regions of the atmosphere.
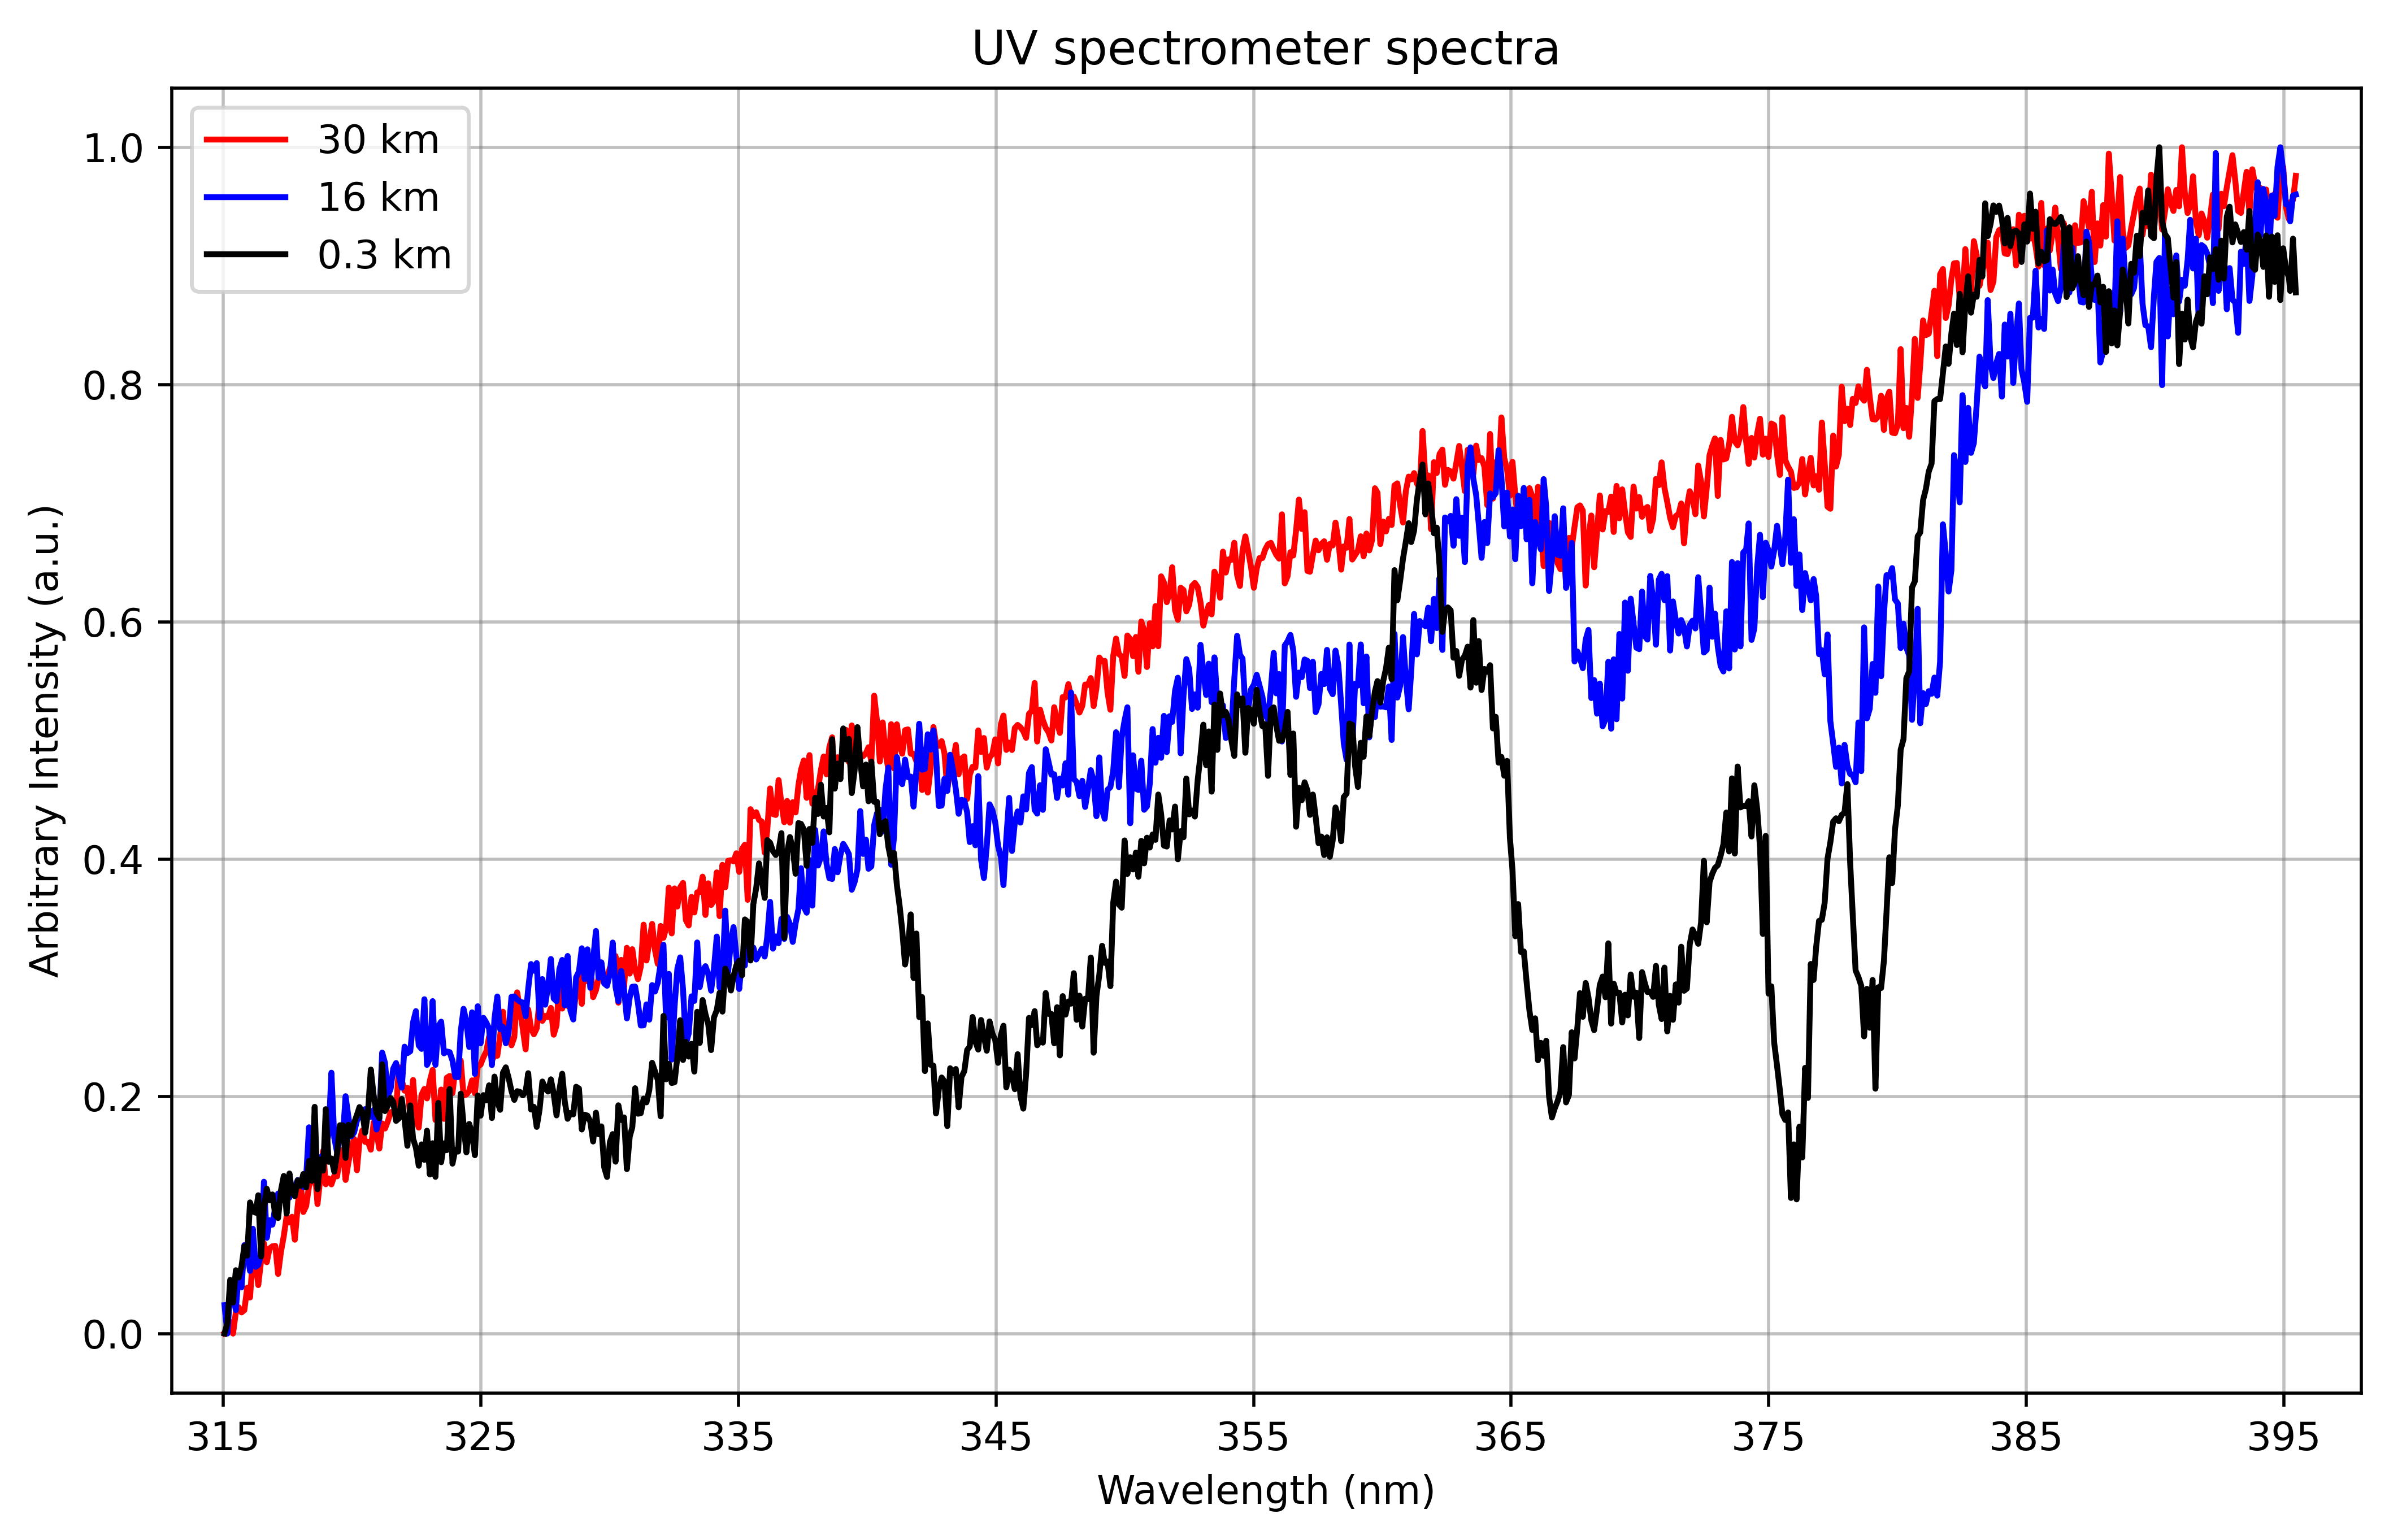
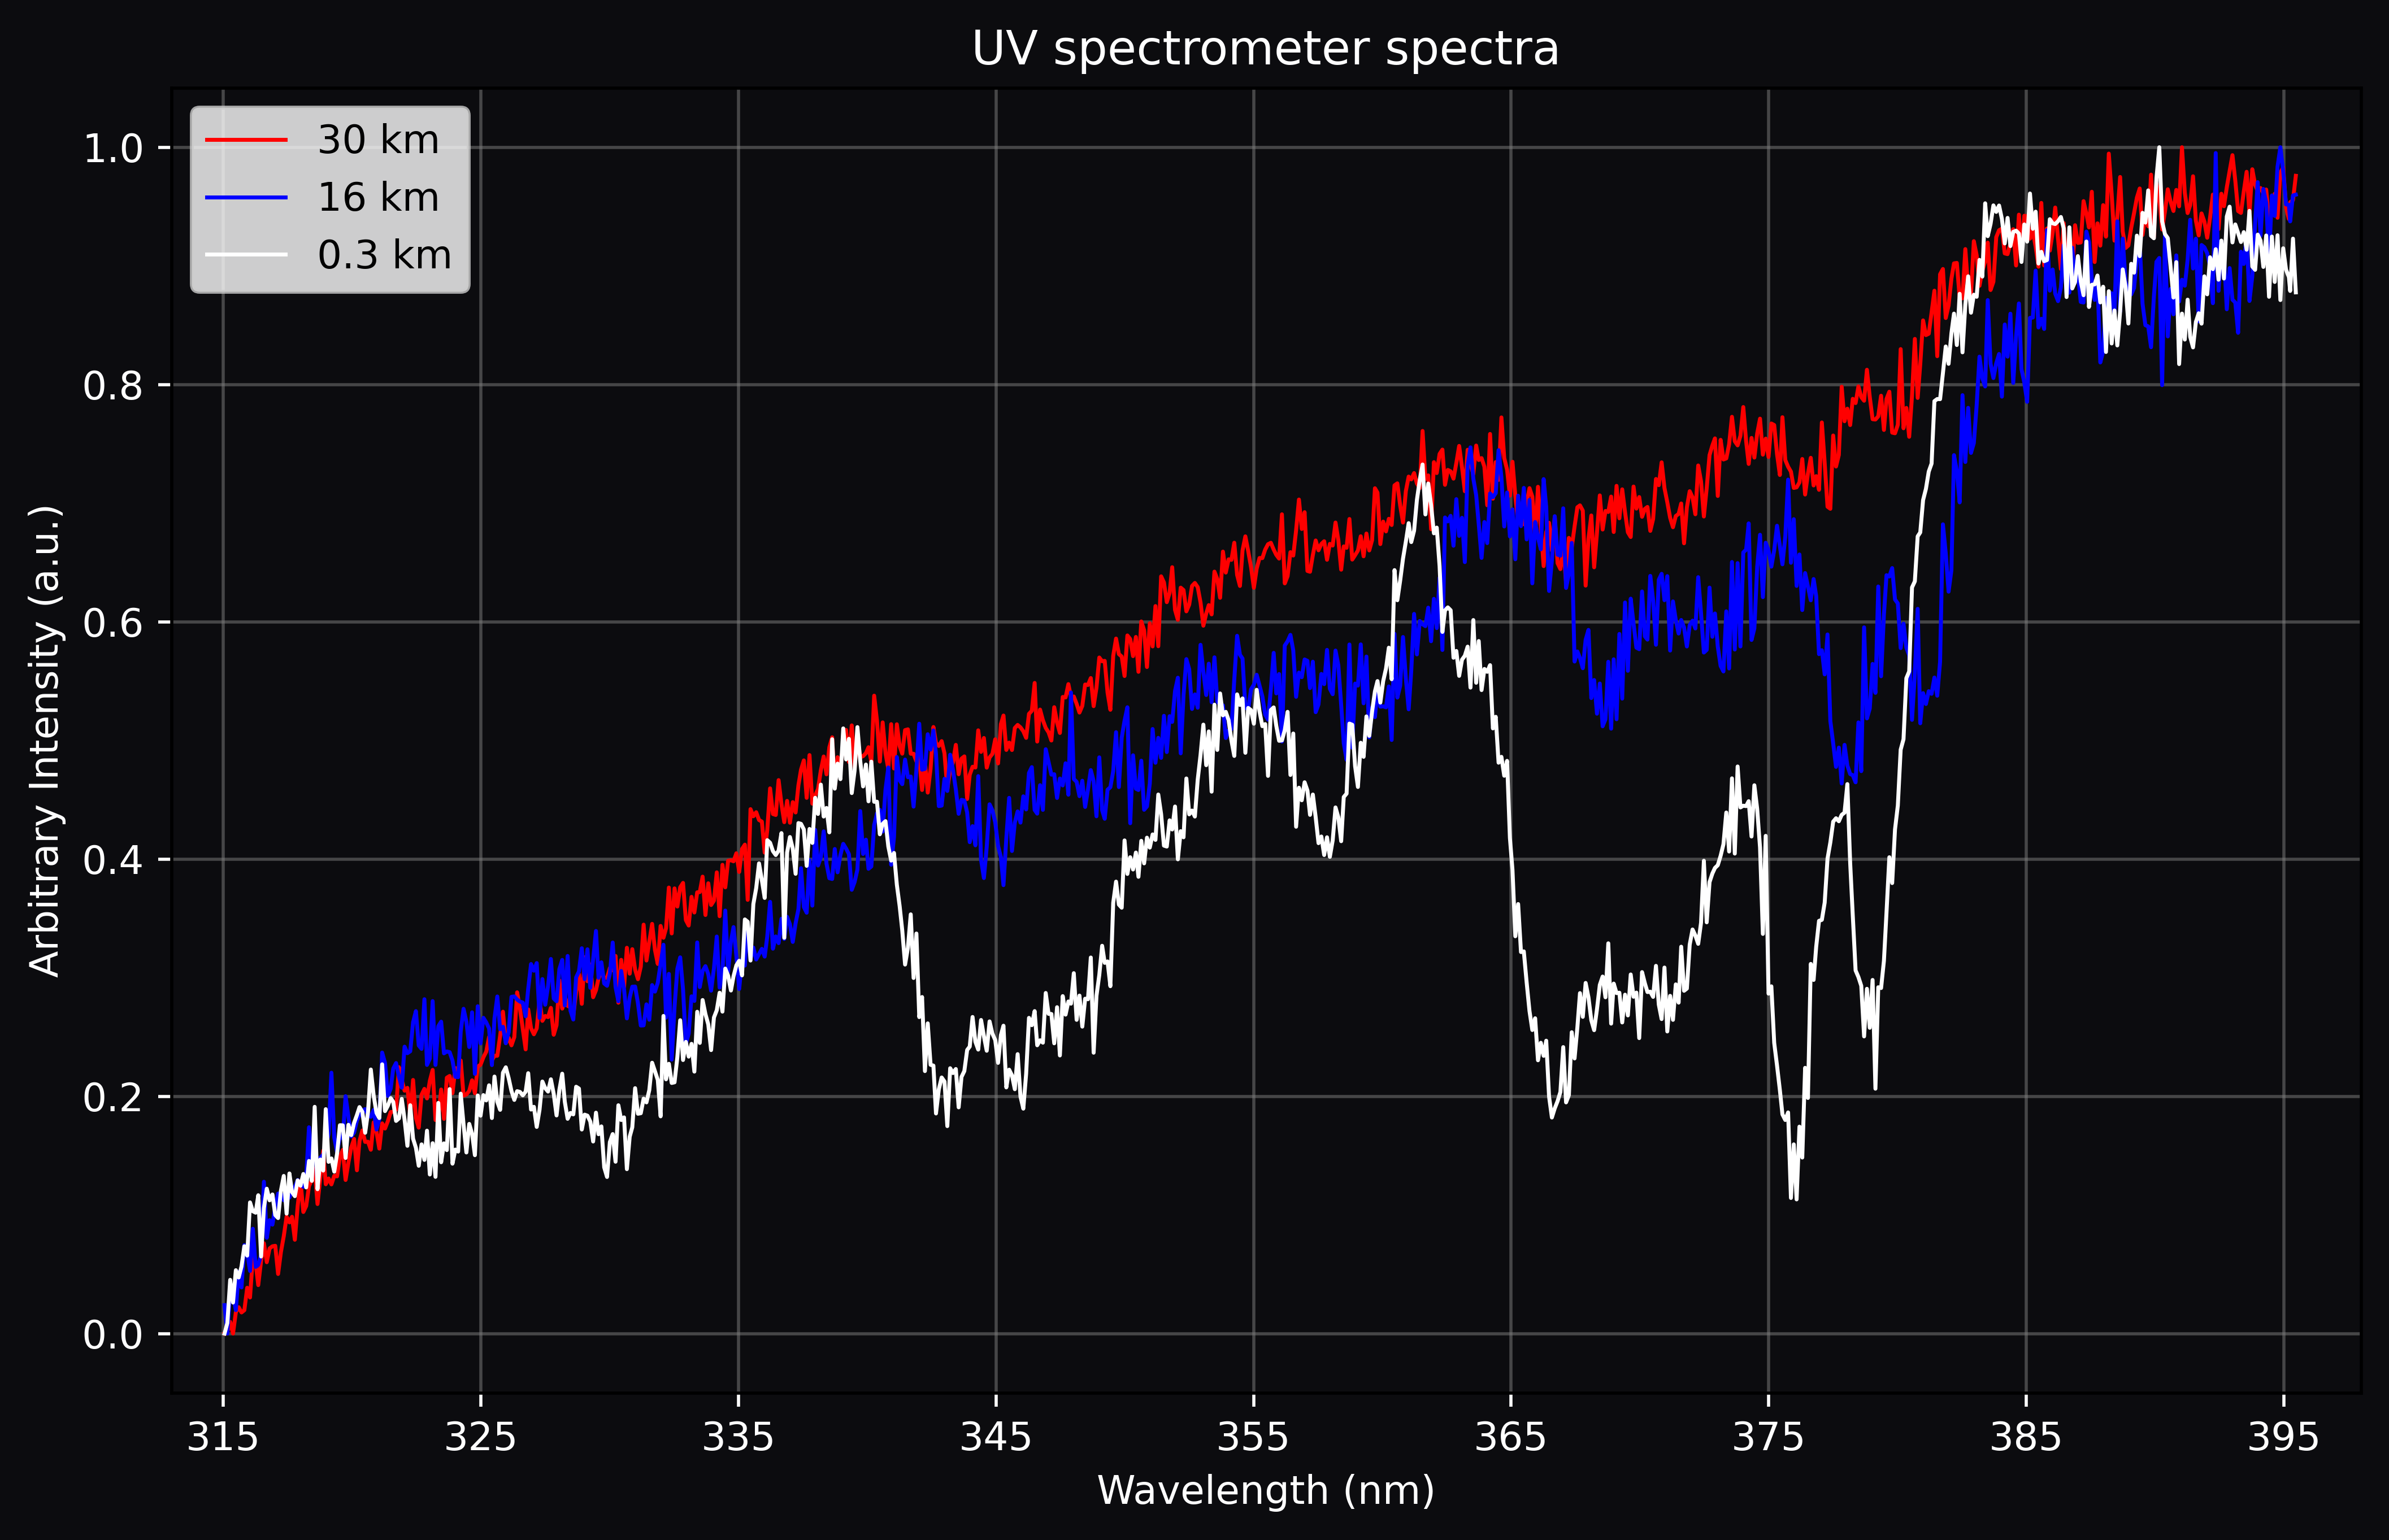
UV Spectra
Using our custom-built UV spectrometer, we captured ultraviolet spectra at various altitudes throughout the atmosphere. Showing that as altitude increases, certain regions in the spectra (e.g. $365\,\mathrm{nm}$ - $380\,\mathrm{nm}$, $340\,\mathrm{nm}$ - $355\,\mathrm{nm}$) show increased intensity. These wavelengths correspond to the upper UV-A range, indicating variations in solar radiation absorption and scattering with altitude.
Recovery
Conclusion
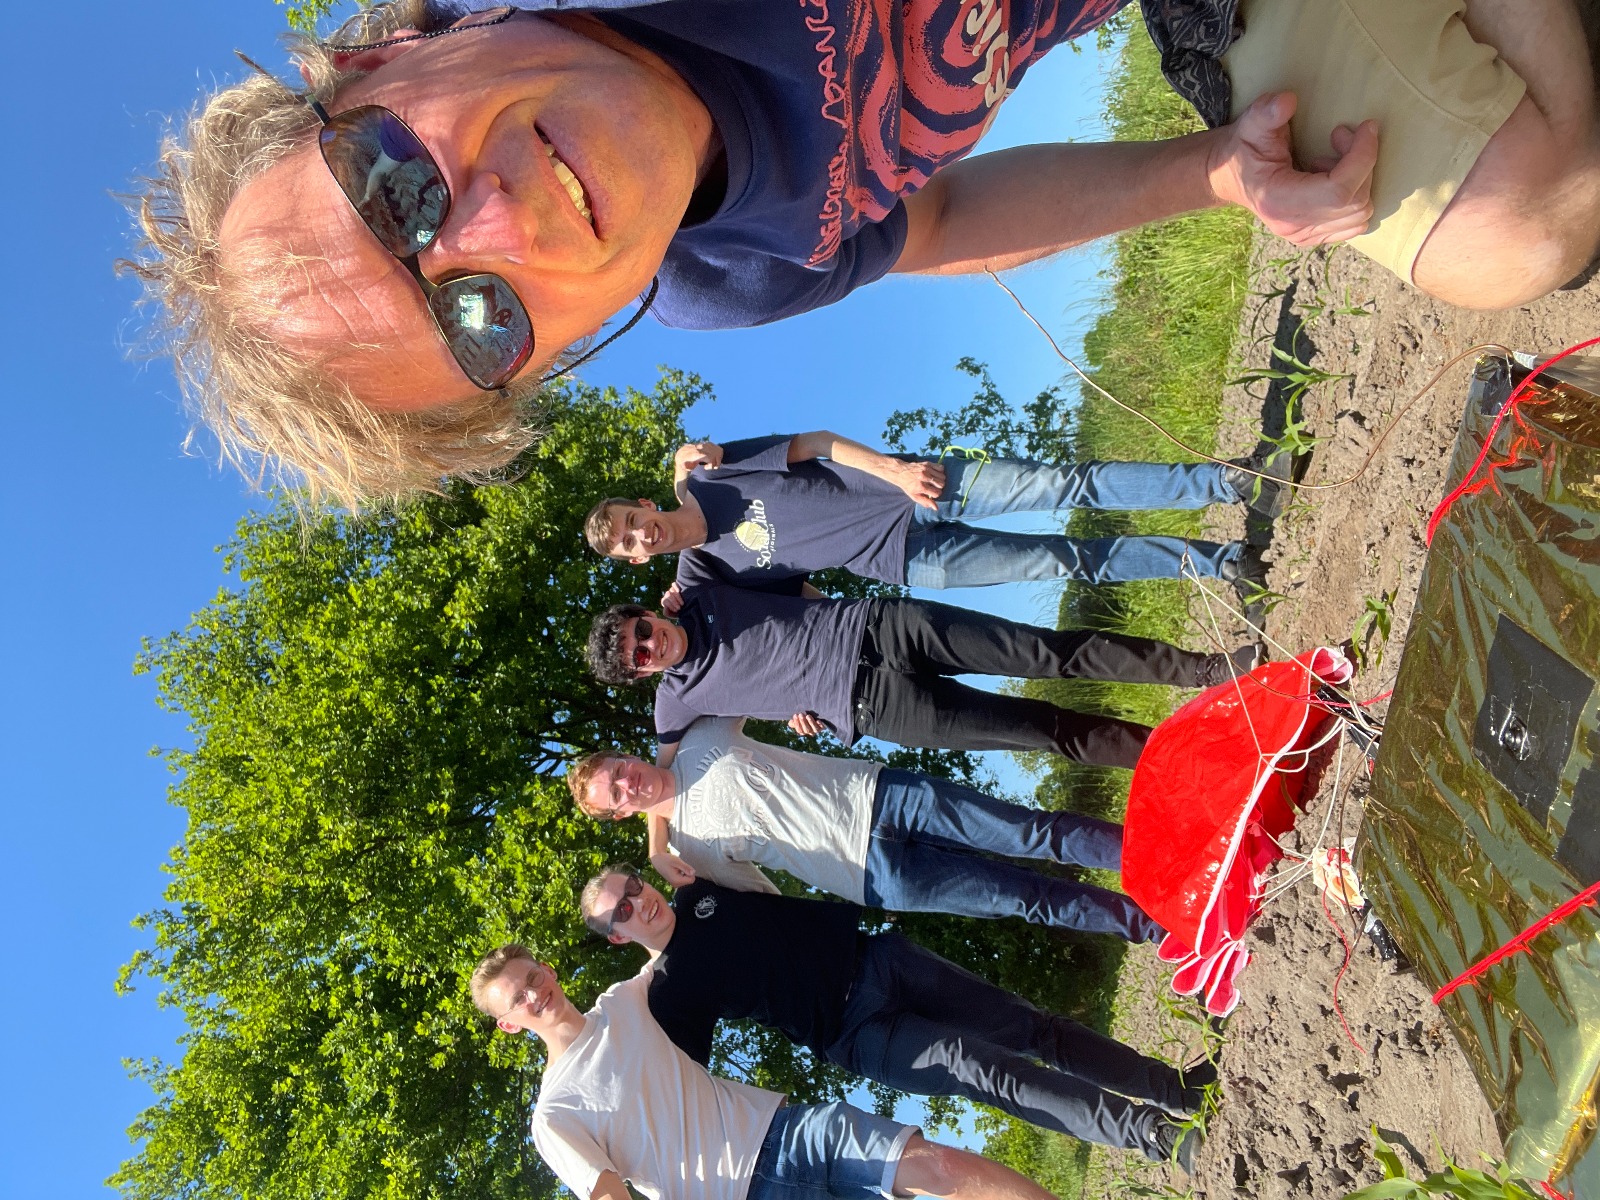
By addressing the tracking and camera issues encountered in the previous flight, we successfully achieved live tracking of the gondola and obtained high-resolution images of Earth from the onboard camera. The mission was a great success: both experiments functioned exactly as intended, allowing us to capture UV spectra as well as continuous temperature and pressure data throughout the entire flight.
Again, many thanks to my teammates Wout Stulens and Achiel Seynhaeve, our partners and volunteers who helped make this second launch possible. If you’re interested in the raw data or wish to send an experiment to the stratosphere (preferably high school students), feel free to contact me.
 |   |   |   |  |
Sources
Layers of the Atmosphere - National Oceanic and Atmospheric Administration. Accessed March 12, 2025. https://www.noaa.gov/jetstream/atmosphere/layers-of-atmosphere ↩︎