Pi in the sky: Launch 1
The maiden launch of the high-altitude balloon program carrying scientific experiments to the stratosphere.
Pi in the Sky is a student-led high-altitude balloon program combining engineering and physics to carry scientific payloads into the stratosphere. See the main project post for a general overview.
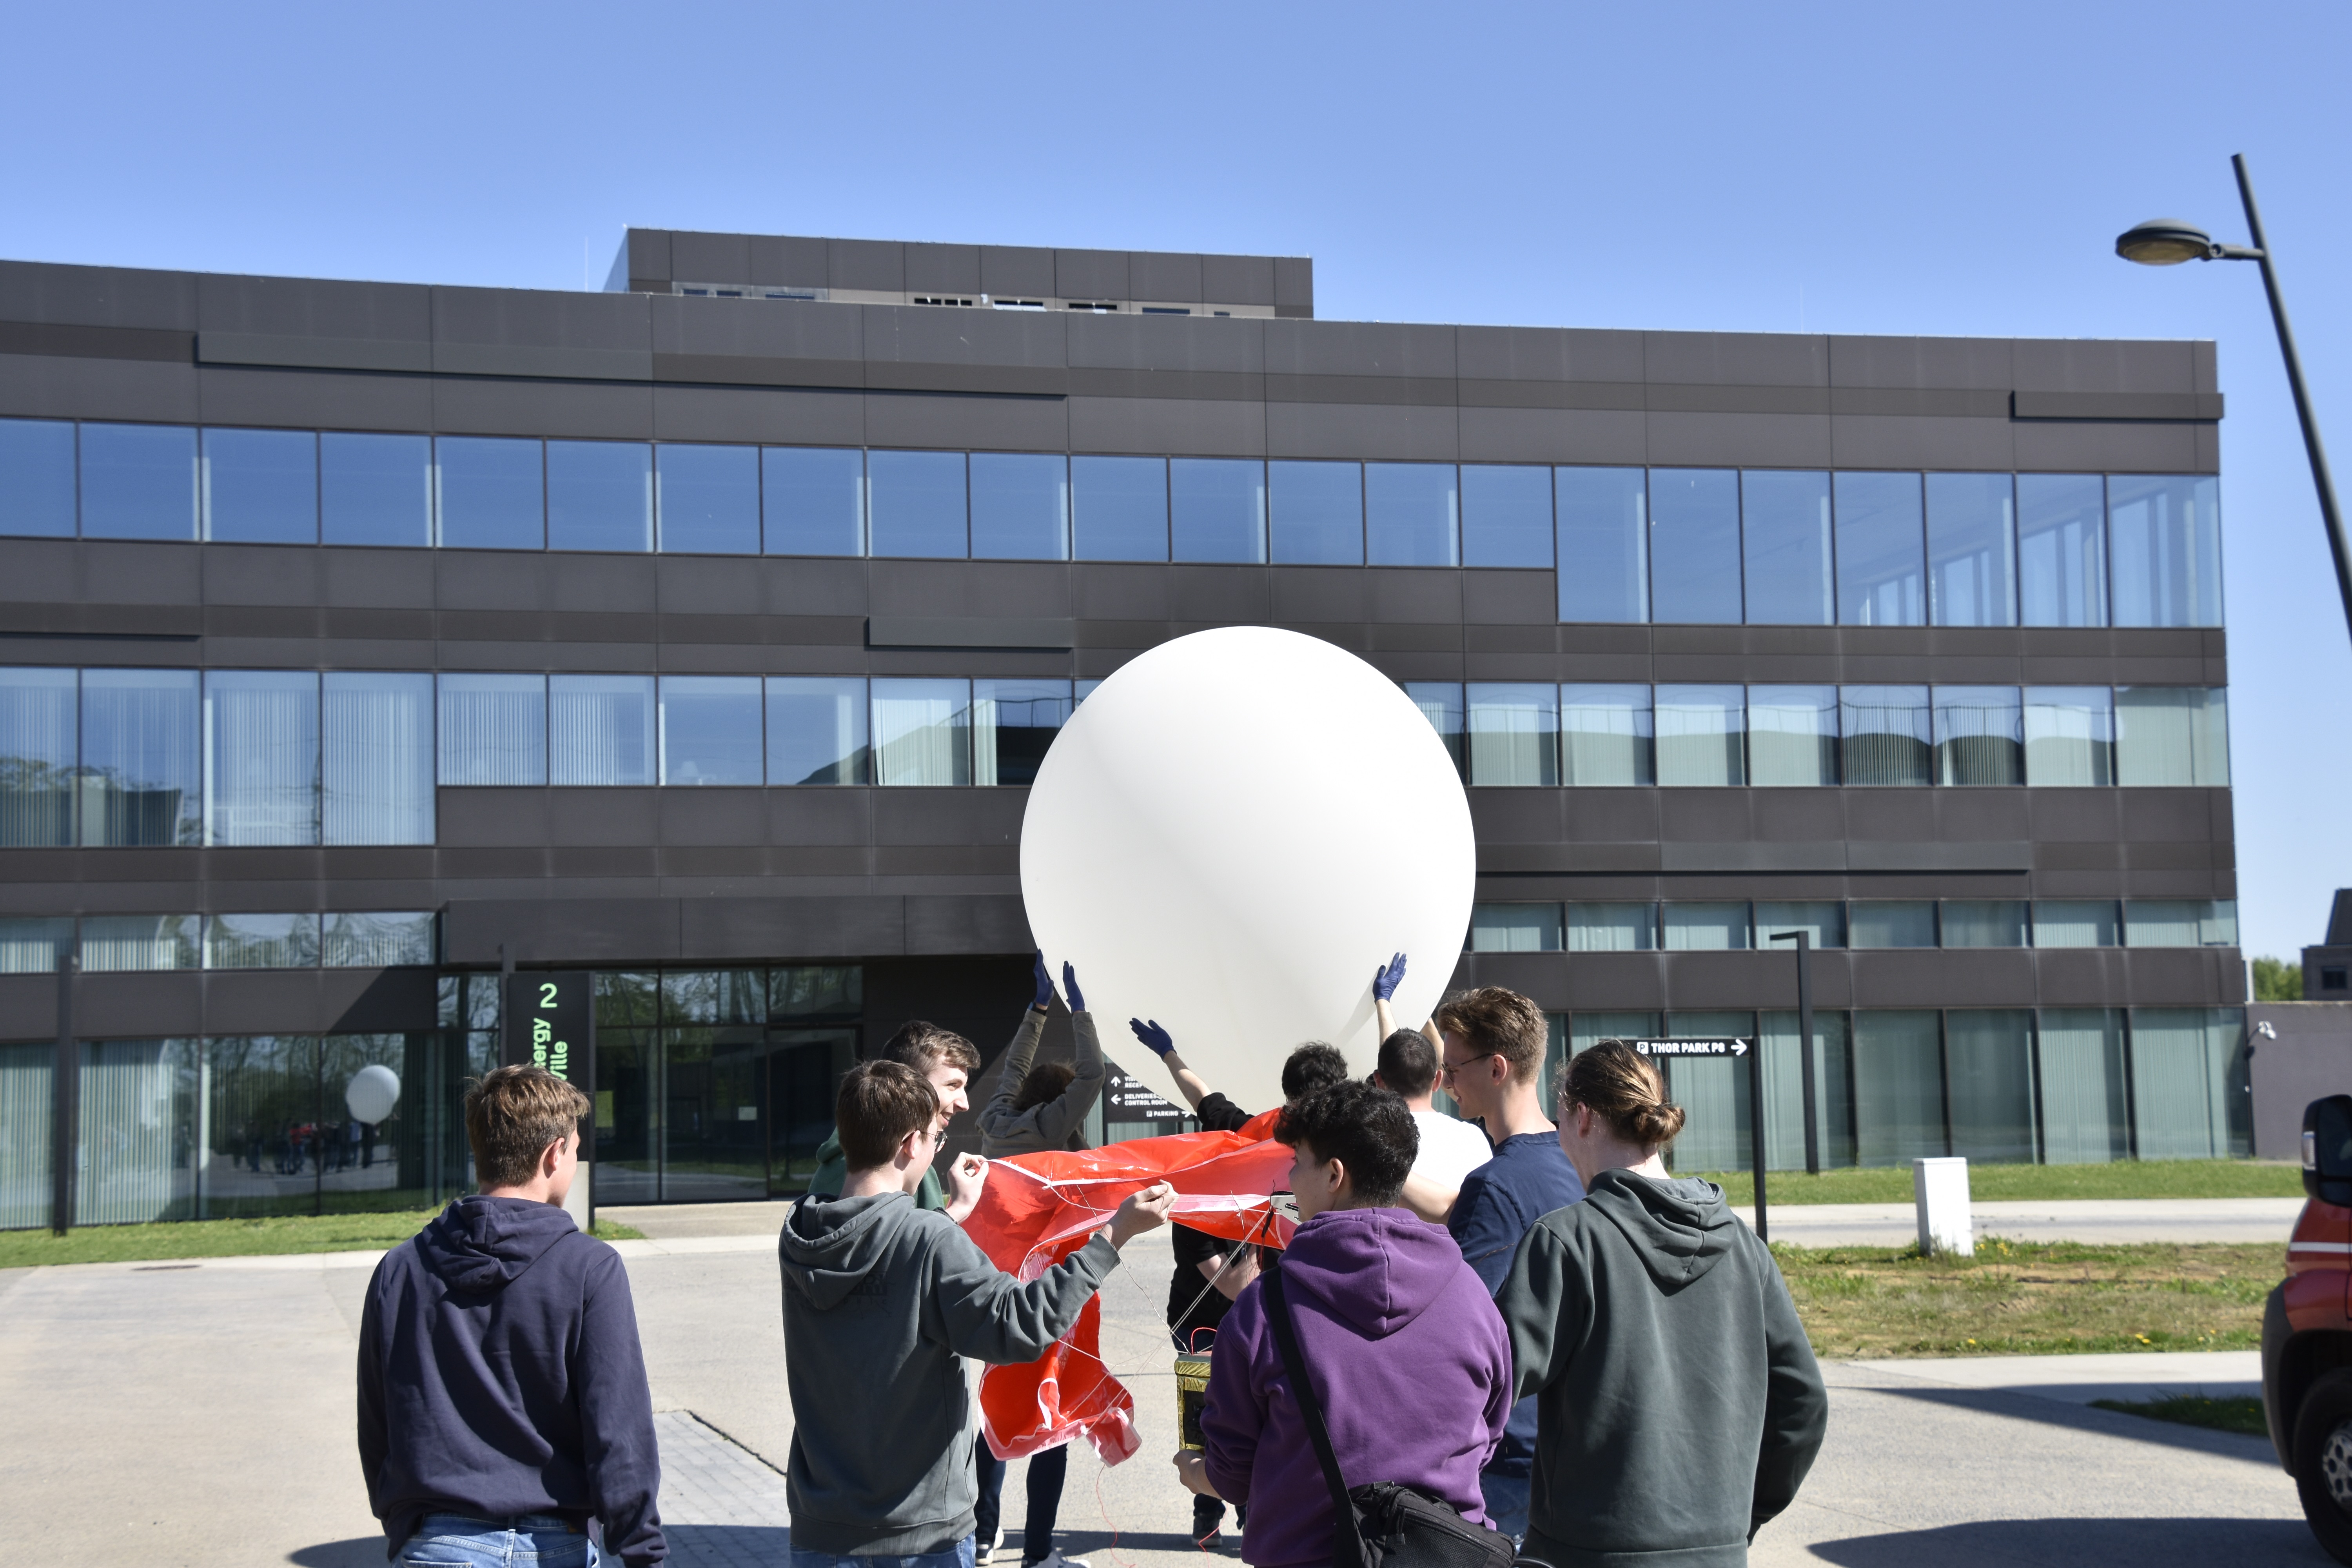
On 27/04/2025, the first ever Pi in the Sky launch took place, lifting off from Thor Park ($50.994938^\circ\,\mathrm{N}$, $5.538705^\circ\,\mathrm{E}$). As the project’s inaugural flight, the launch tested key systems including GPS tracking, APRS telemetry, and onboard imaging.
Weather conditions were excellent, with a clear blue sky and calm winds. The balloon was released at around 11:00 LT and rose steadily into the stratosphere. After a smooth ascent into the sky and bursting at an altitude of $41.60 \,\mathrm{km}$, it descended and landed safely in the Maas River in Maastricht, Netherlands. The payload was promptly recovered from the water with the help of the local water club. The mission was a complete success, with a flawless launch, safe recovery, and experiment data collected.
Launch
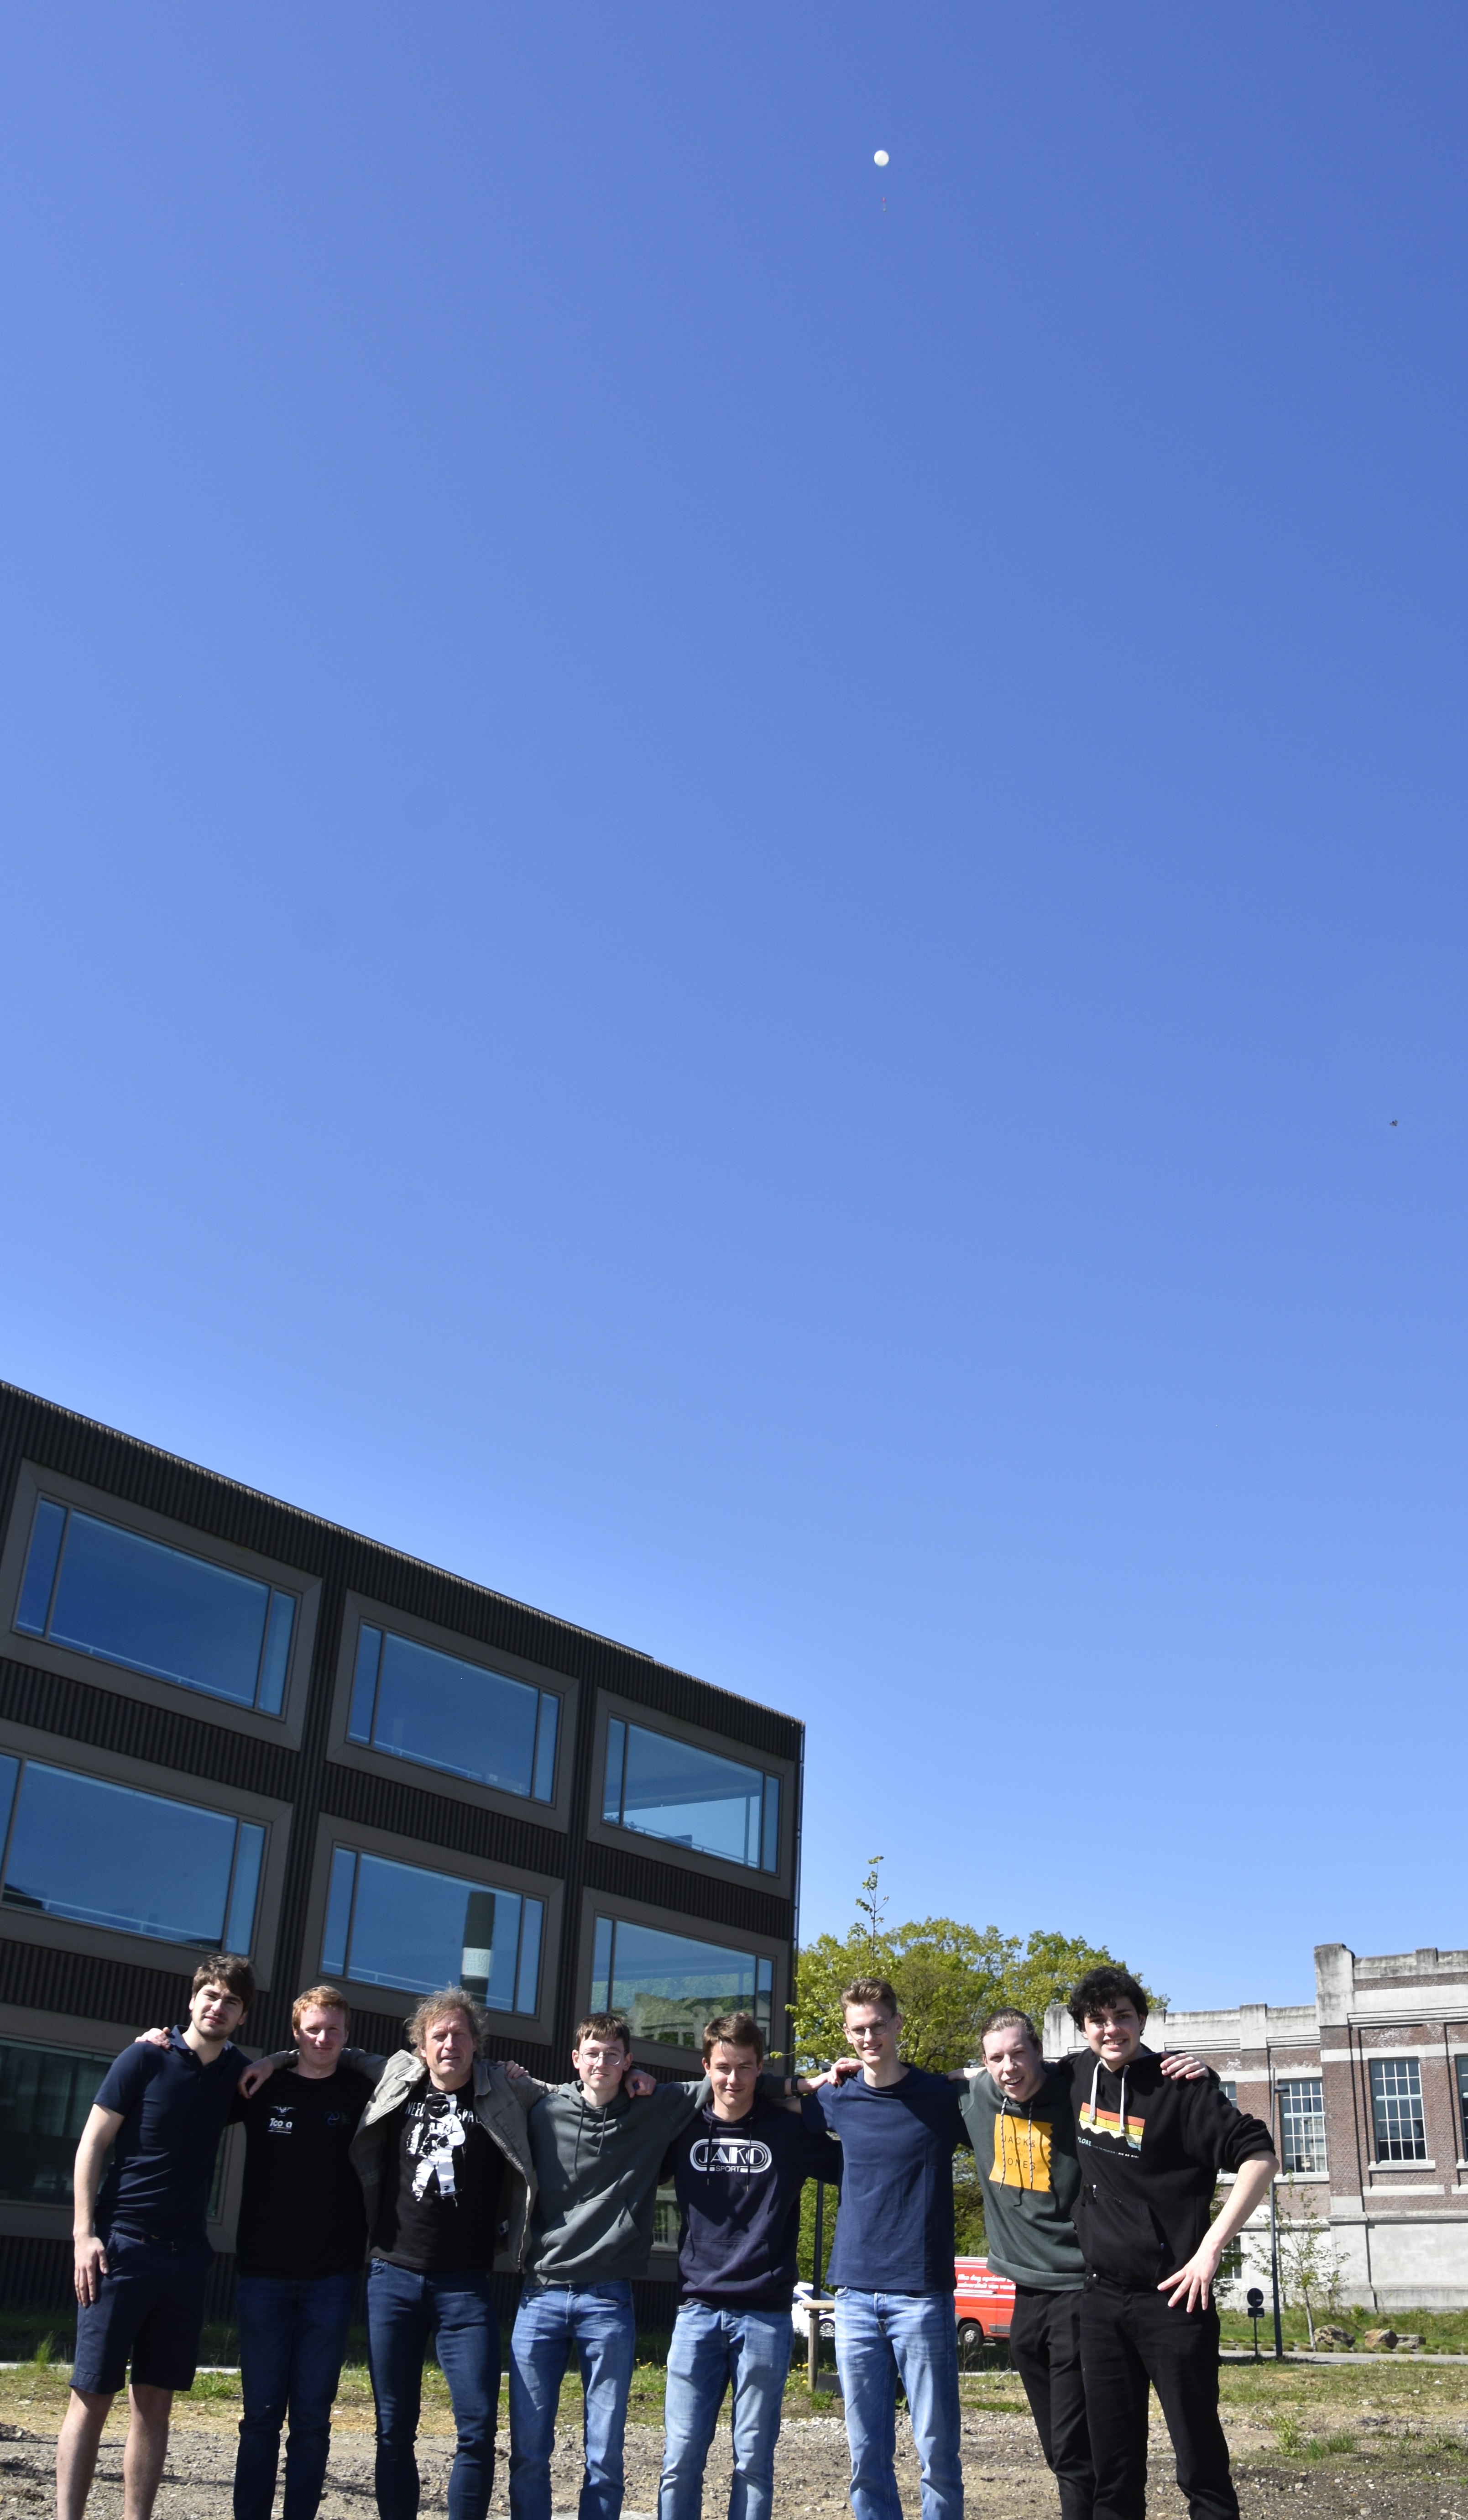
With the help of volunteers and the team, the balloon was carefully prepared and safely released under great applause. Watch the video below to experience the launch firsthand.
Results
With the gondola and experiments successfully recovered, we are pleased to present our findings. The measurements provide a detailed profile of atmospheric conditions and UV spectra from the surface up to an altitude of approximately $42\,\mathrm{km}$.
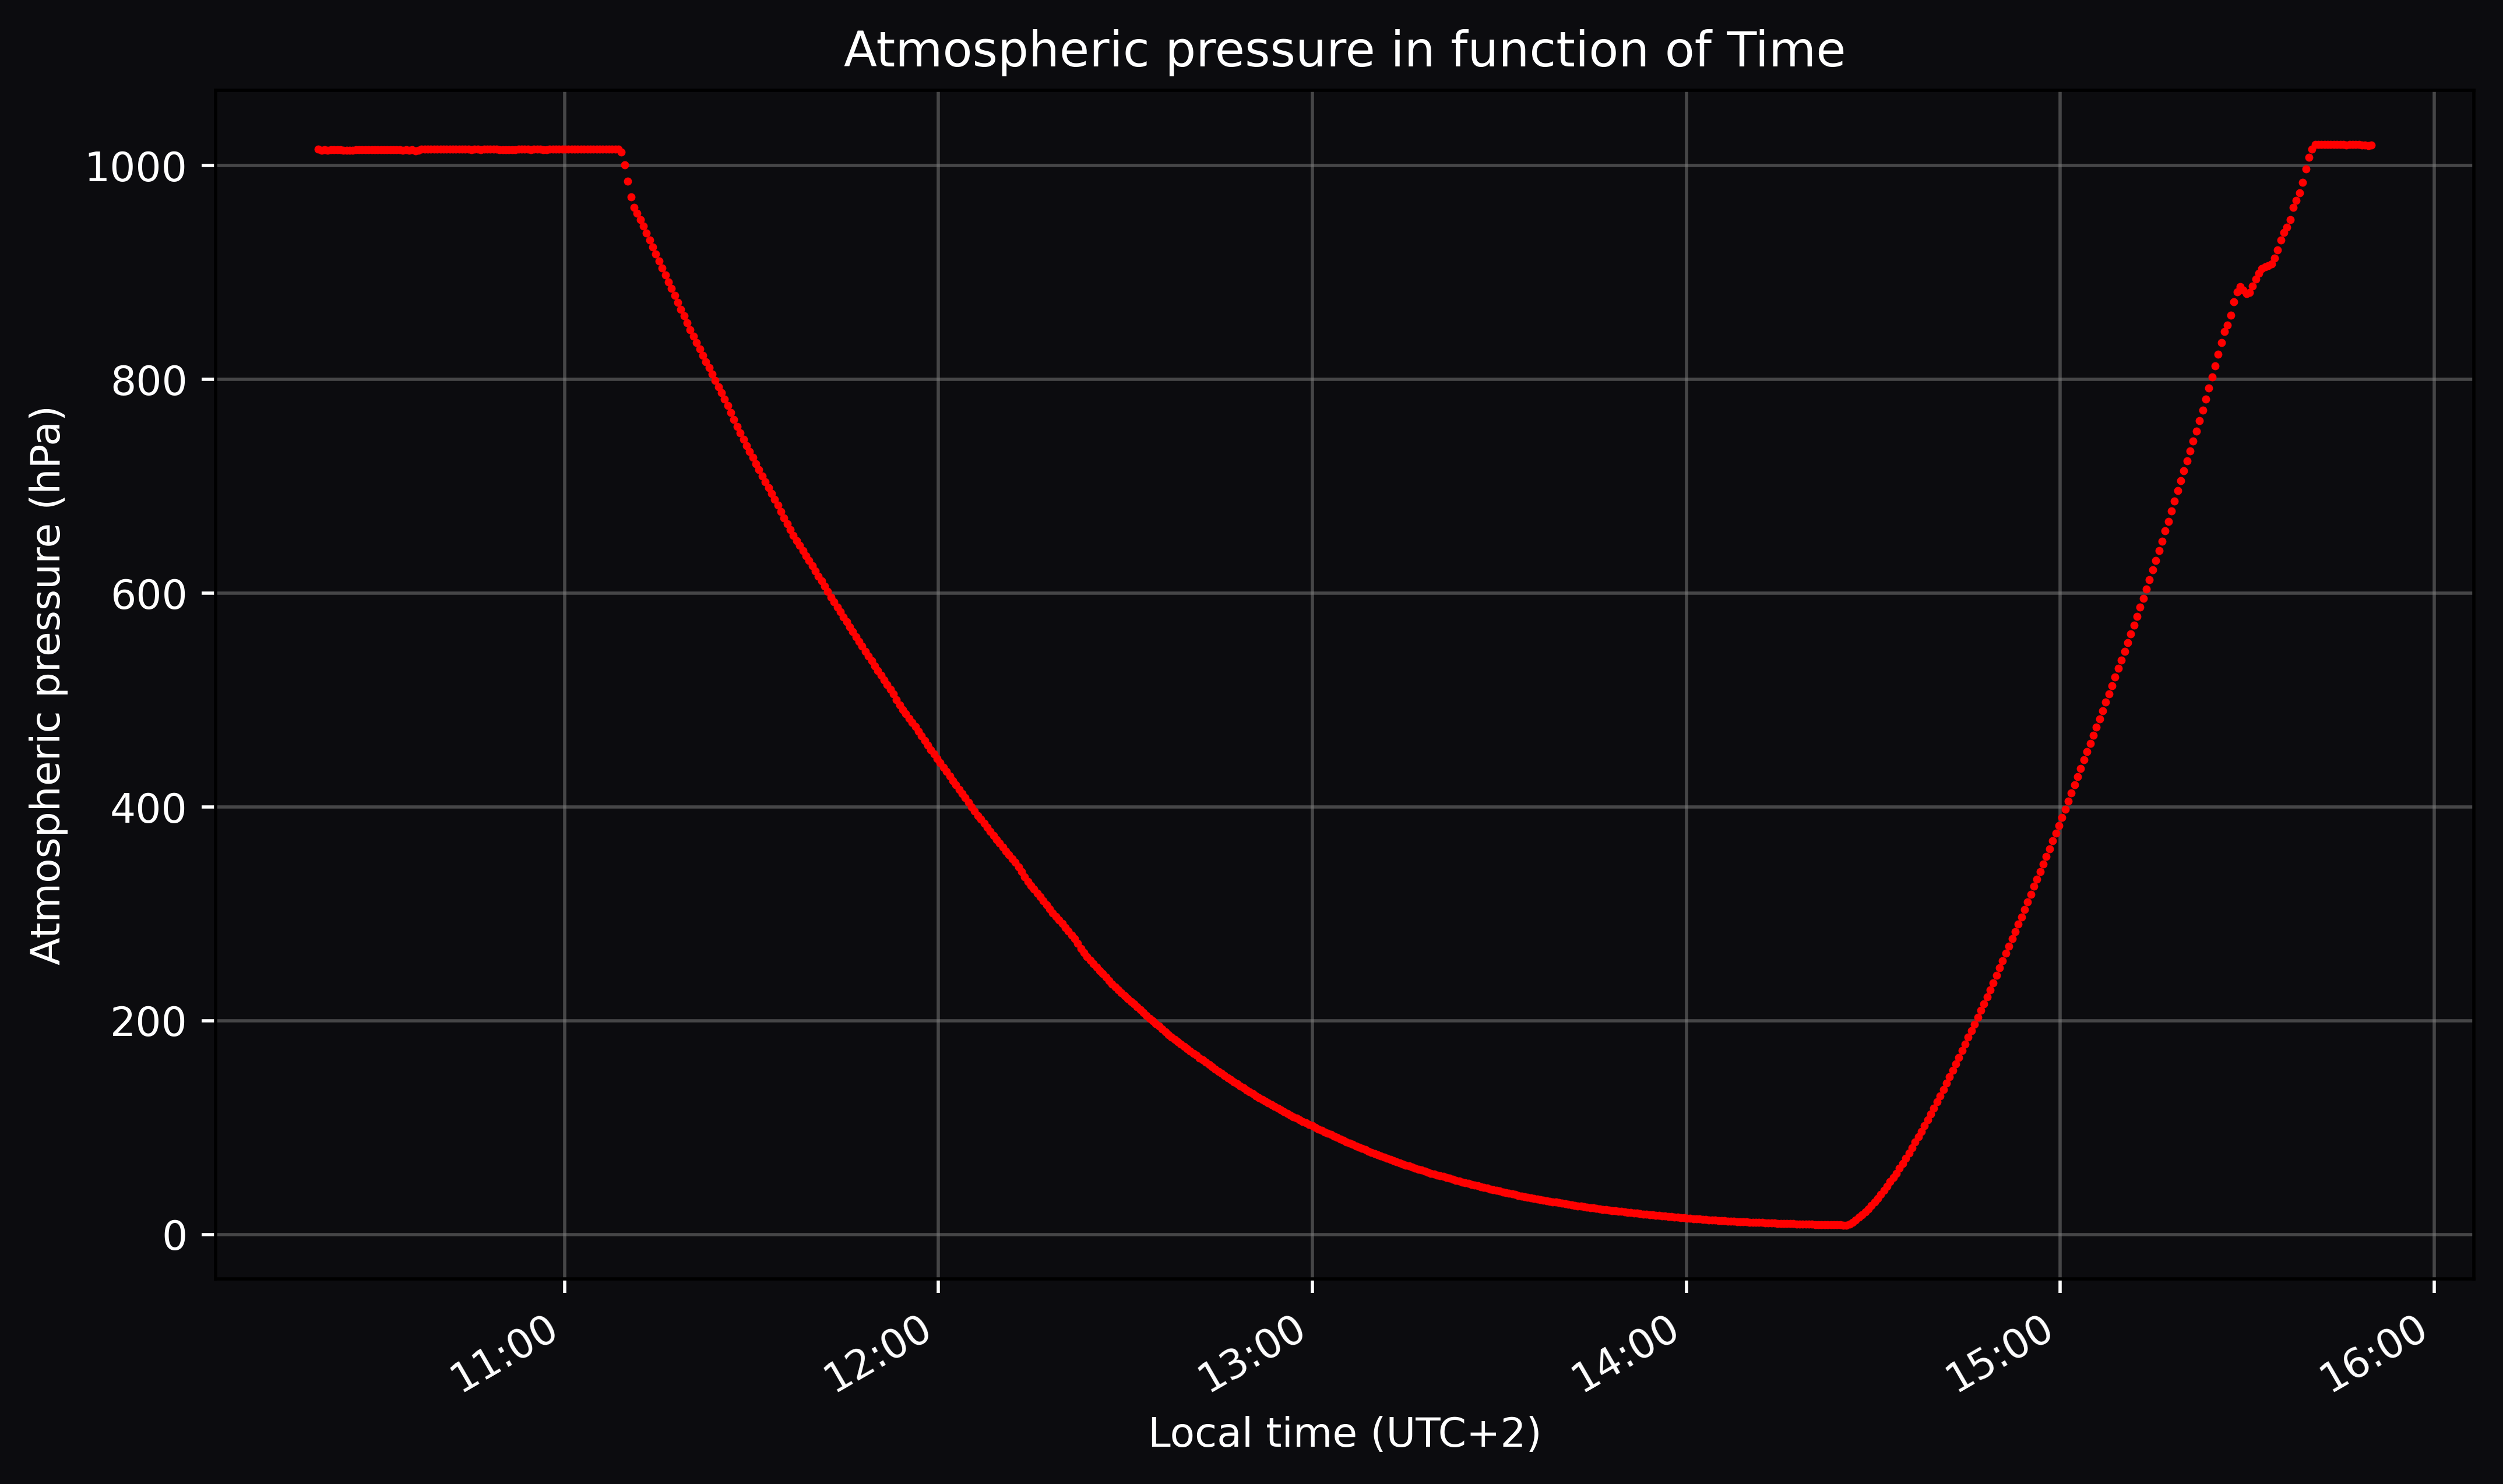
Atmospheric pressure
The atmospheric pressure was measured at intervals of $30\,\mathrm{s}$ and synchronized with the local time of the launch. At the peak of the flight, a pressure of $8.62 \, \mathrm{hPa}$ was recorded. This is considered a low vacuum, although it remains several orders of magnitude higher than pressures typically achieved in laboratory vacuum chambers.

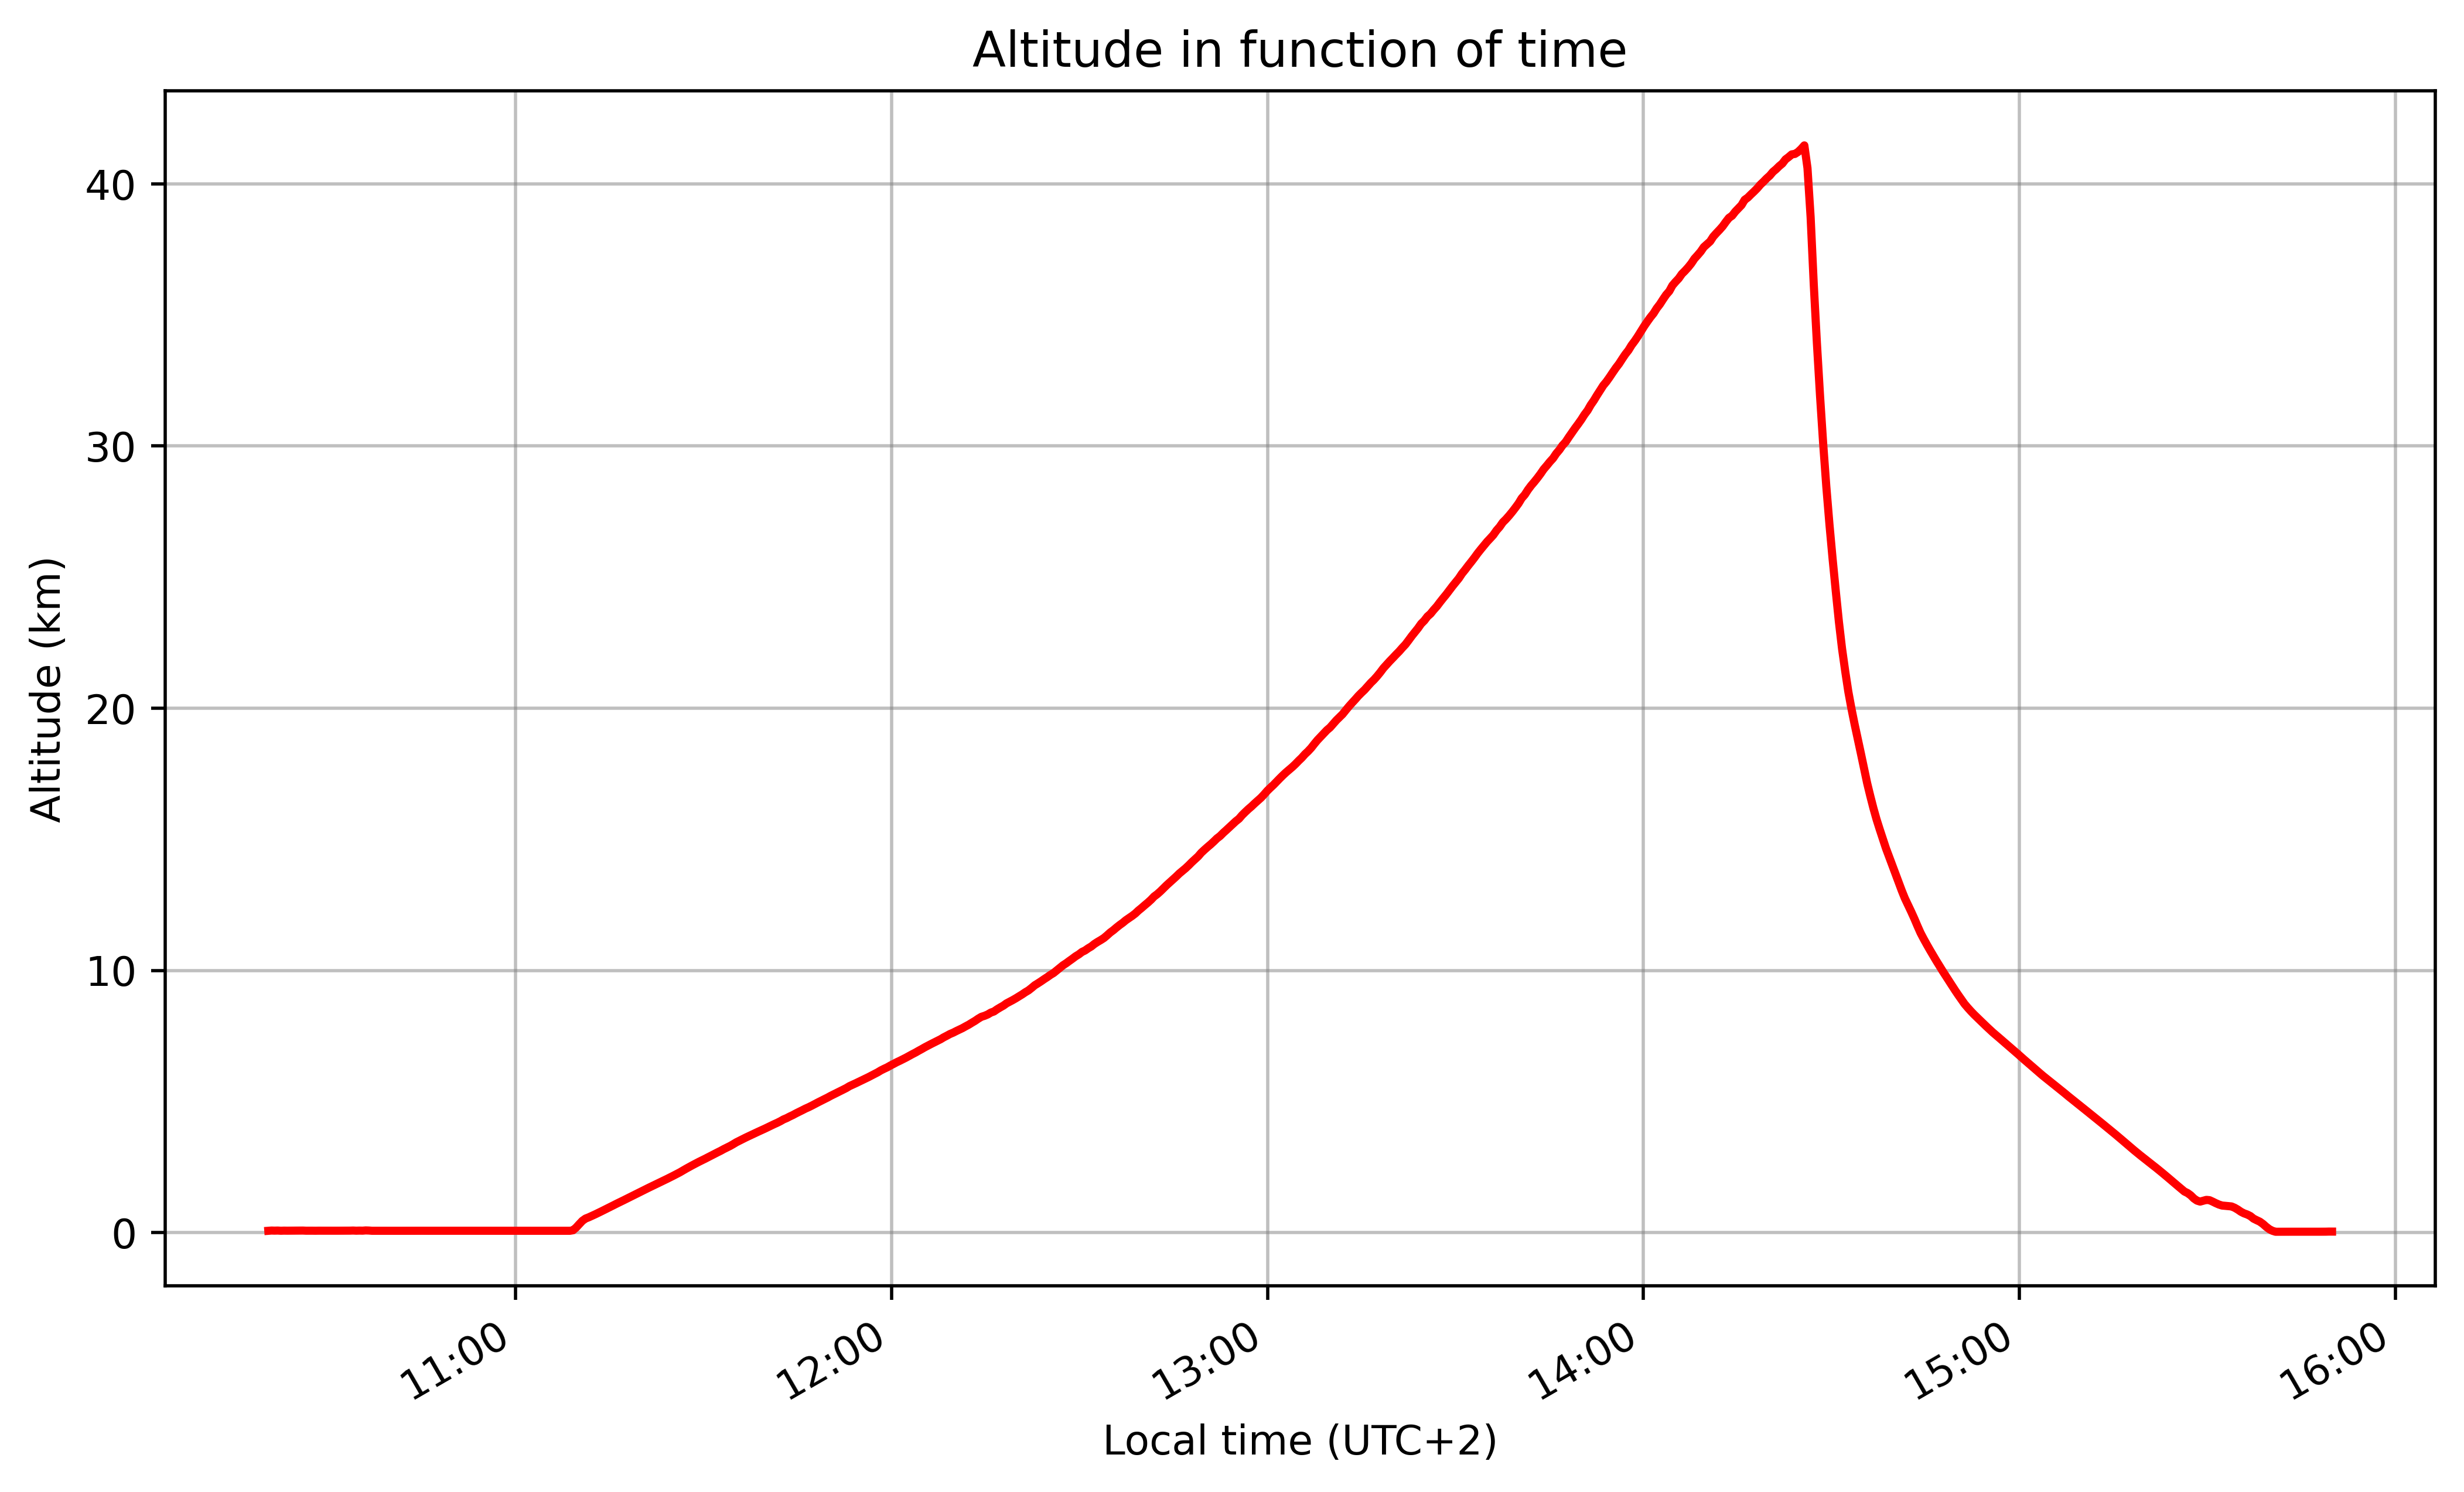
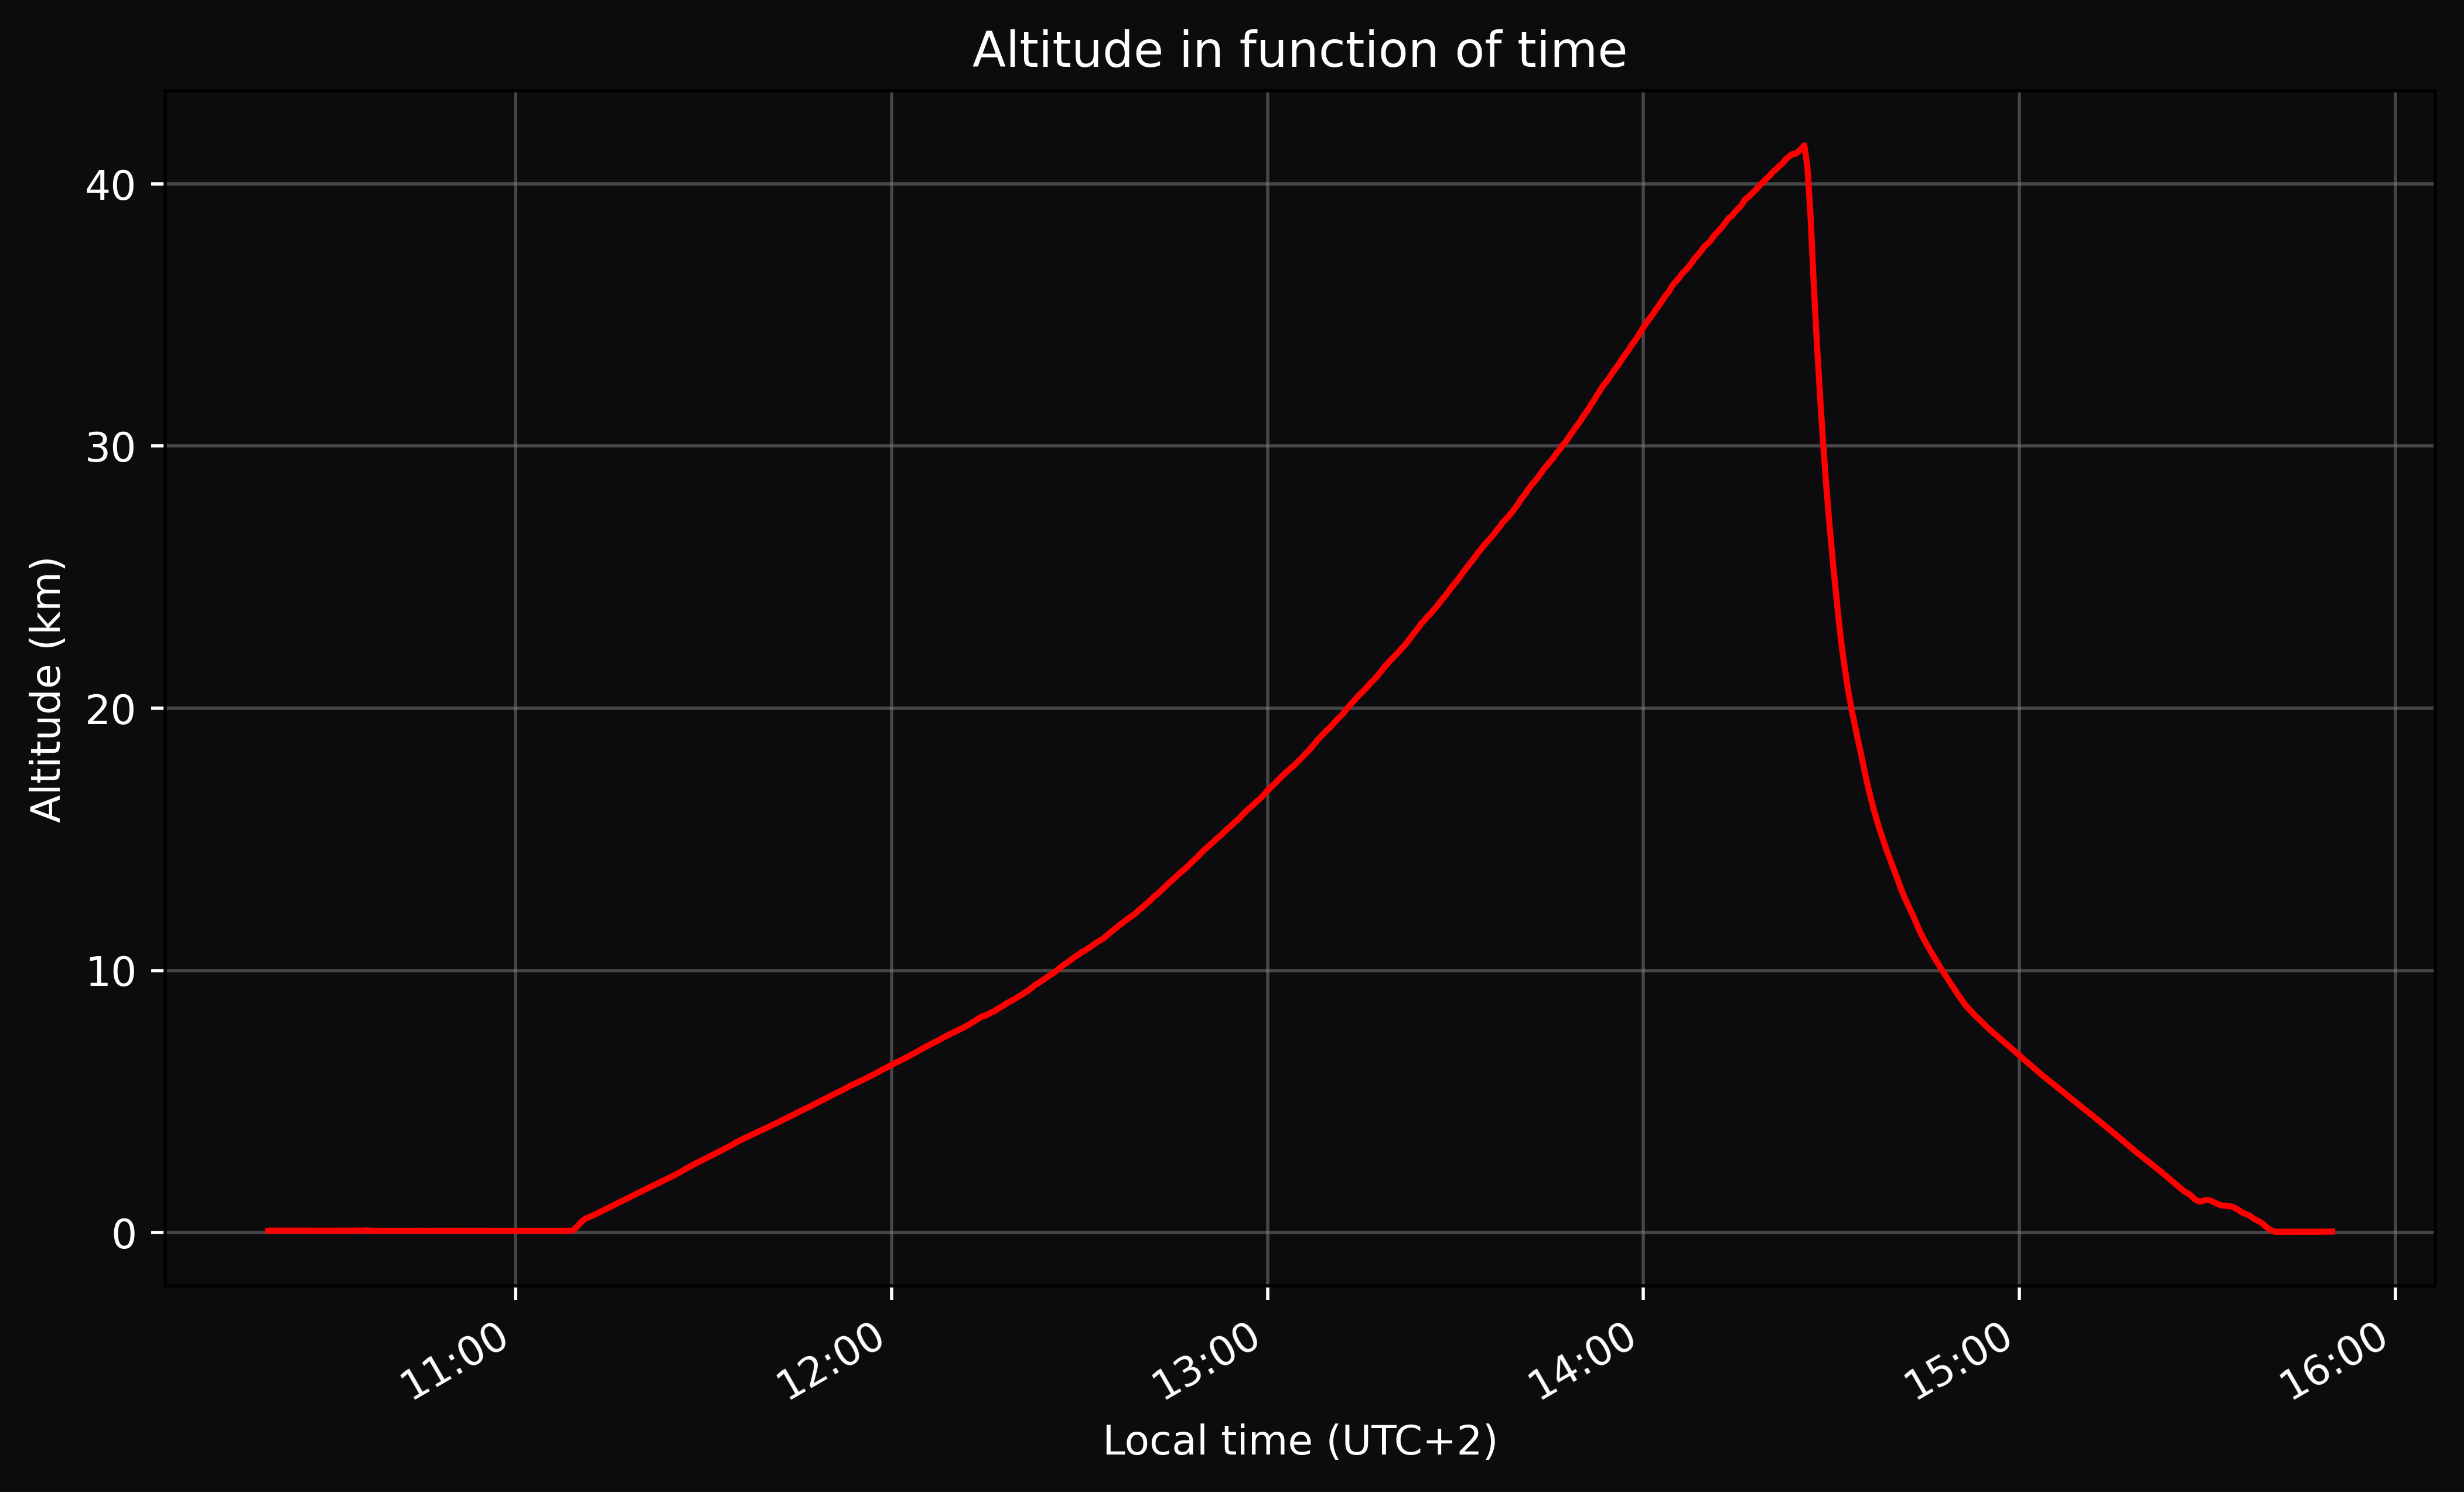
Altitude vs Time
As both atmospheric pressure and outside temperature were measured during flight, it is possible to calculate the altitude using the barometric formula,1
\[P = P_0 \,\exp\left(\frac{-m\,g\,h}{k\,T}\right)\]or in molar form, with substitutions of molar mass and Boltzmann constant relation, $m = \frac{M}{N_A}$ and $k = \frac{R}{N_A}$,
\[\begin{align*} P &= P_0\,\exp\left(\frac{-\frac{M}{N_A}\,g\,h}{ \frac{R}{N_A}\,T}\right) \\ &= P_0\,\exp\left(\frac{-Mg\,h}{RT}\right) \end{align*}\]Now define altitude as the height above the terrain level, $h = h’ - h_0$,
\[P = P_0 \, \exp\left(\dfrac{-g\,M(h'-h_0)}{RT}\right)\]rearranging the equation gives a form for calculating current altitude $h’$,
\[h' = h_0 + \frac{R \, T}{g \, M} \, \ln\!\left(\frac{P_0}{P}\right)\]with $P$ and $T$ as the atmospheric pressure and temperature at altitude, $P_0 = 1014.58 \,\text{hPa}\,$ as the sea-level pressure on 27/04/2025, $h_0 = 80 \,\text{m}$ as the sea-level altitude of the launch site, $g = 9.80665 \,\text{m/s}^2$ as the gravitational acceleration, $M = 0.0289644 \,\text{kg/mol}$ as the molar mass of air, and $R = 8.31432 \,\text{J/(mol·K)}$ as the universal gas constant.
Using this formula, the measured pressure and temperature data can be converted into altitude values throughout the flight.
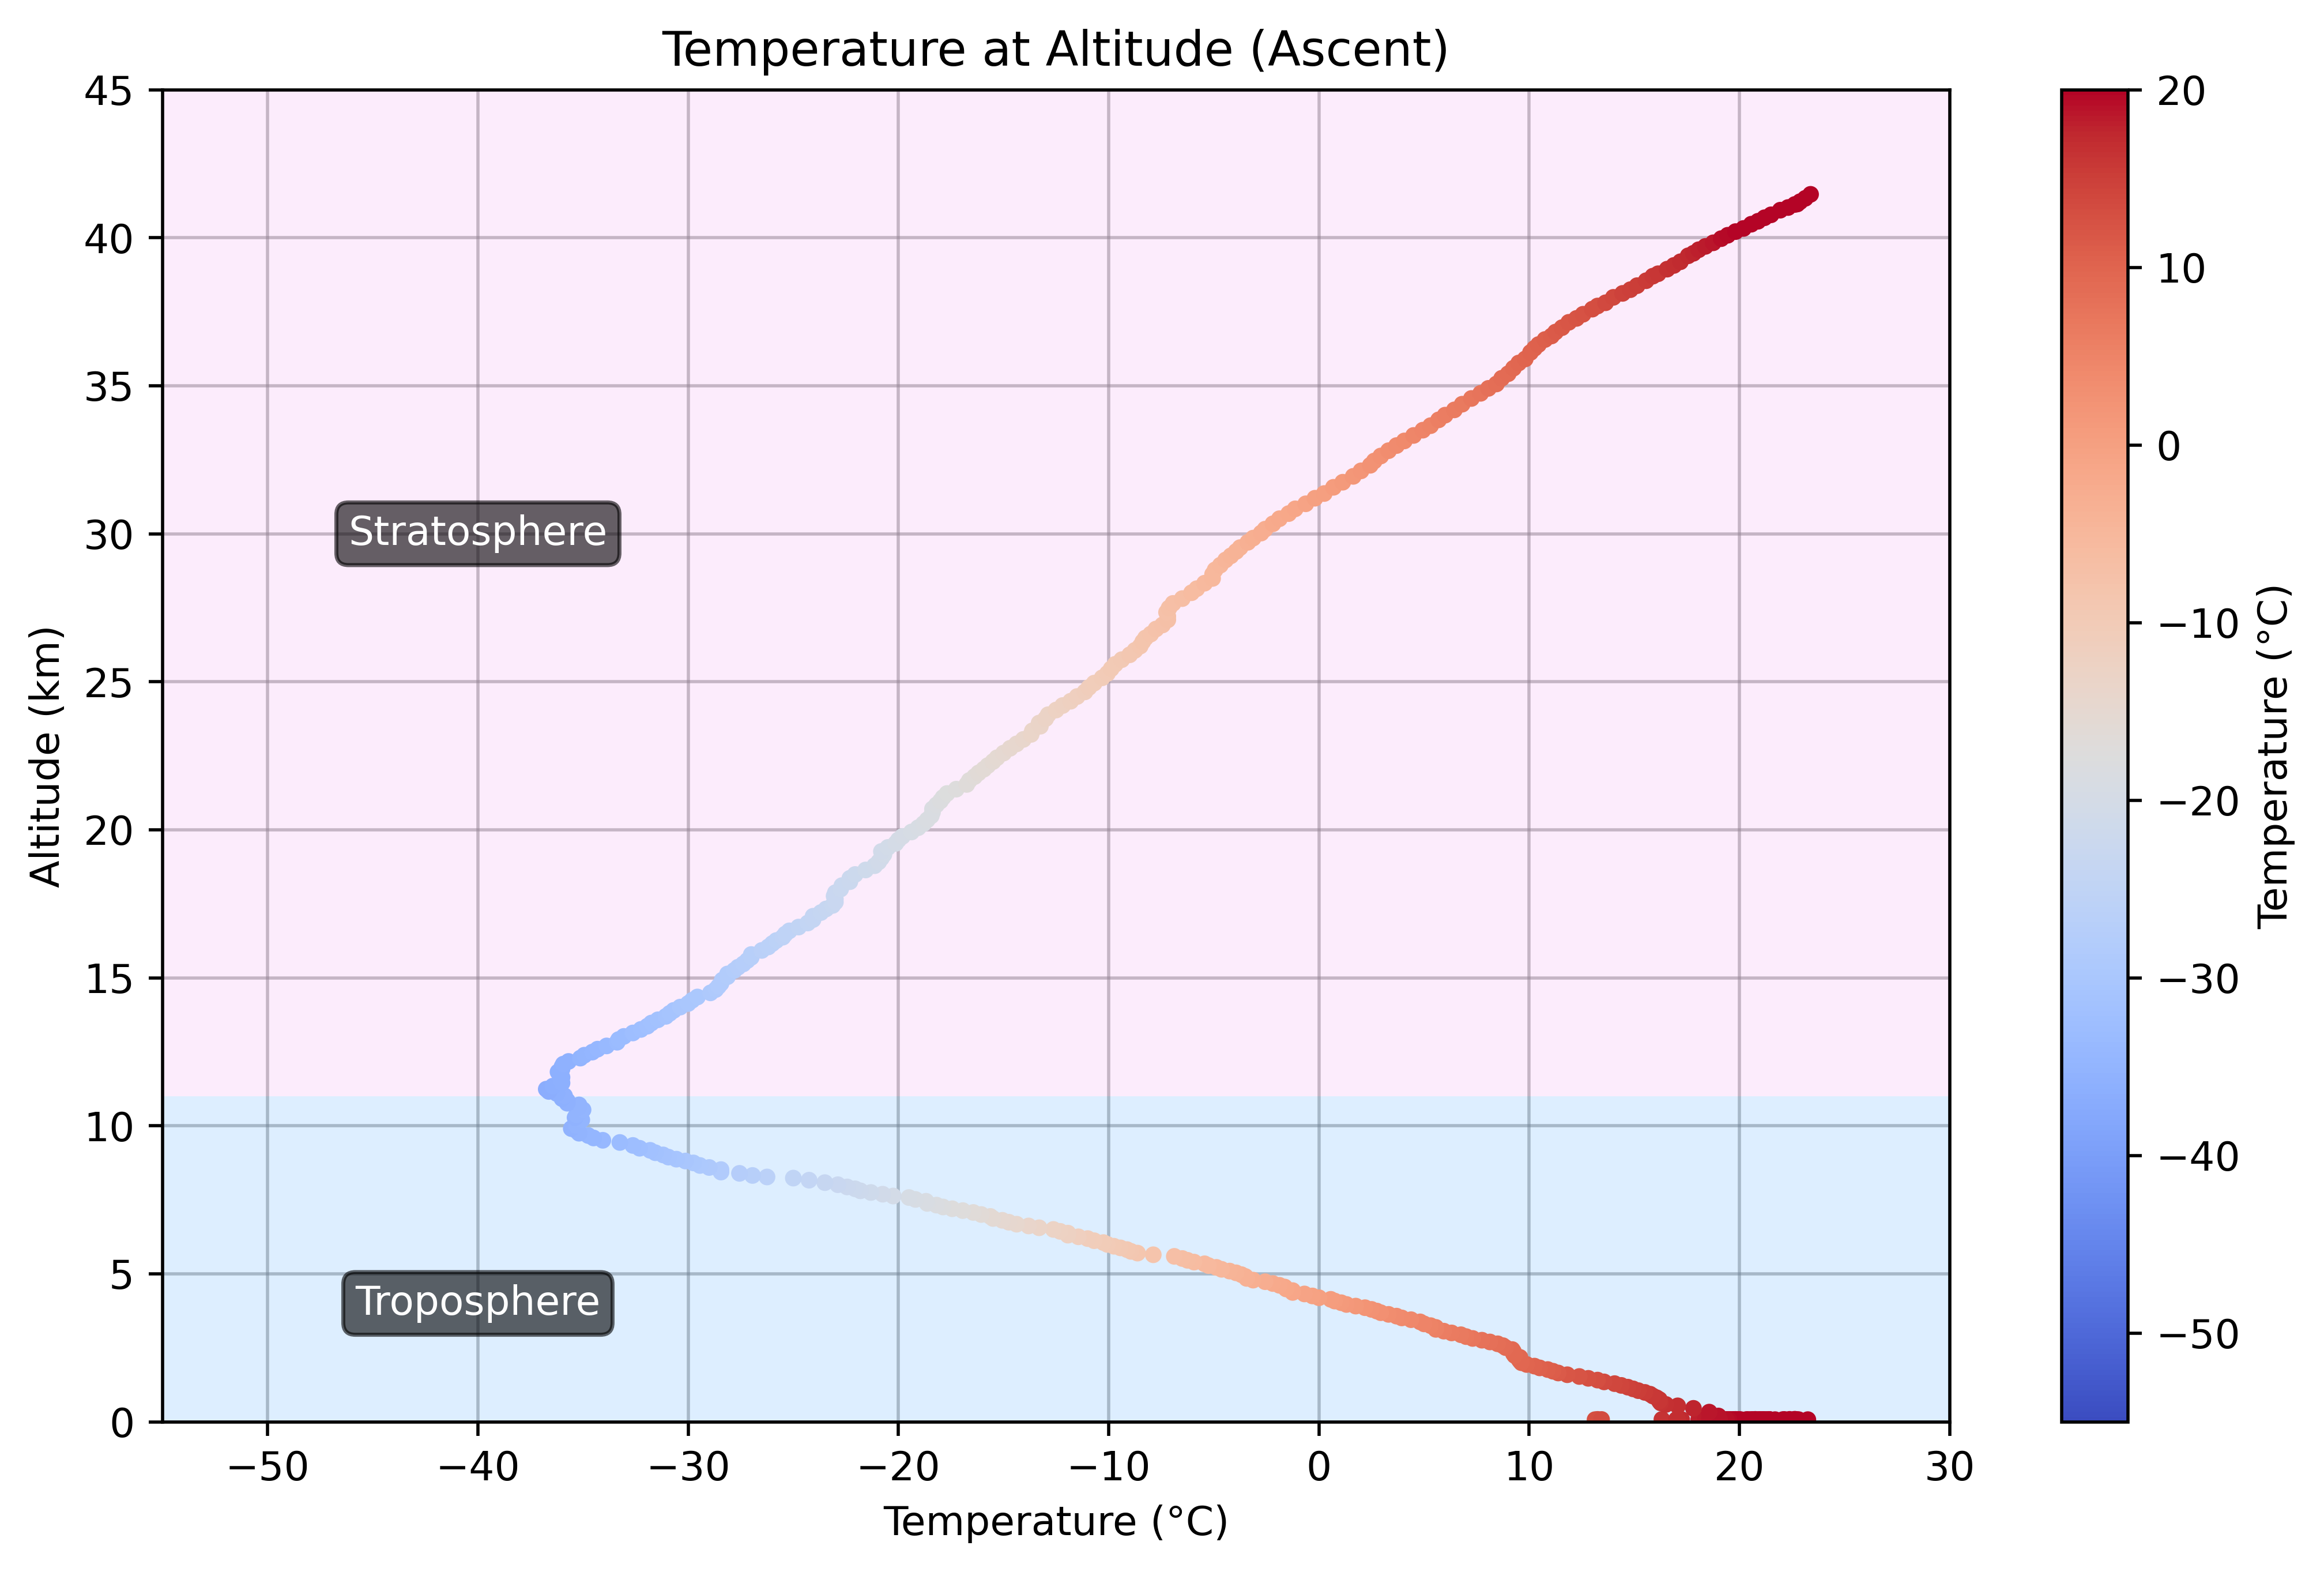
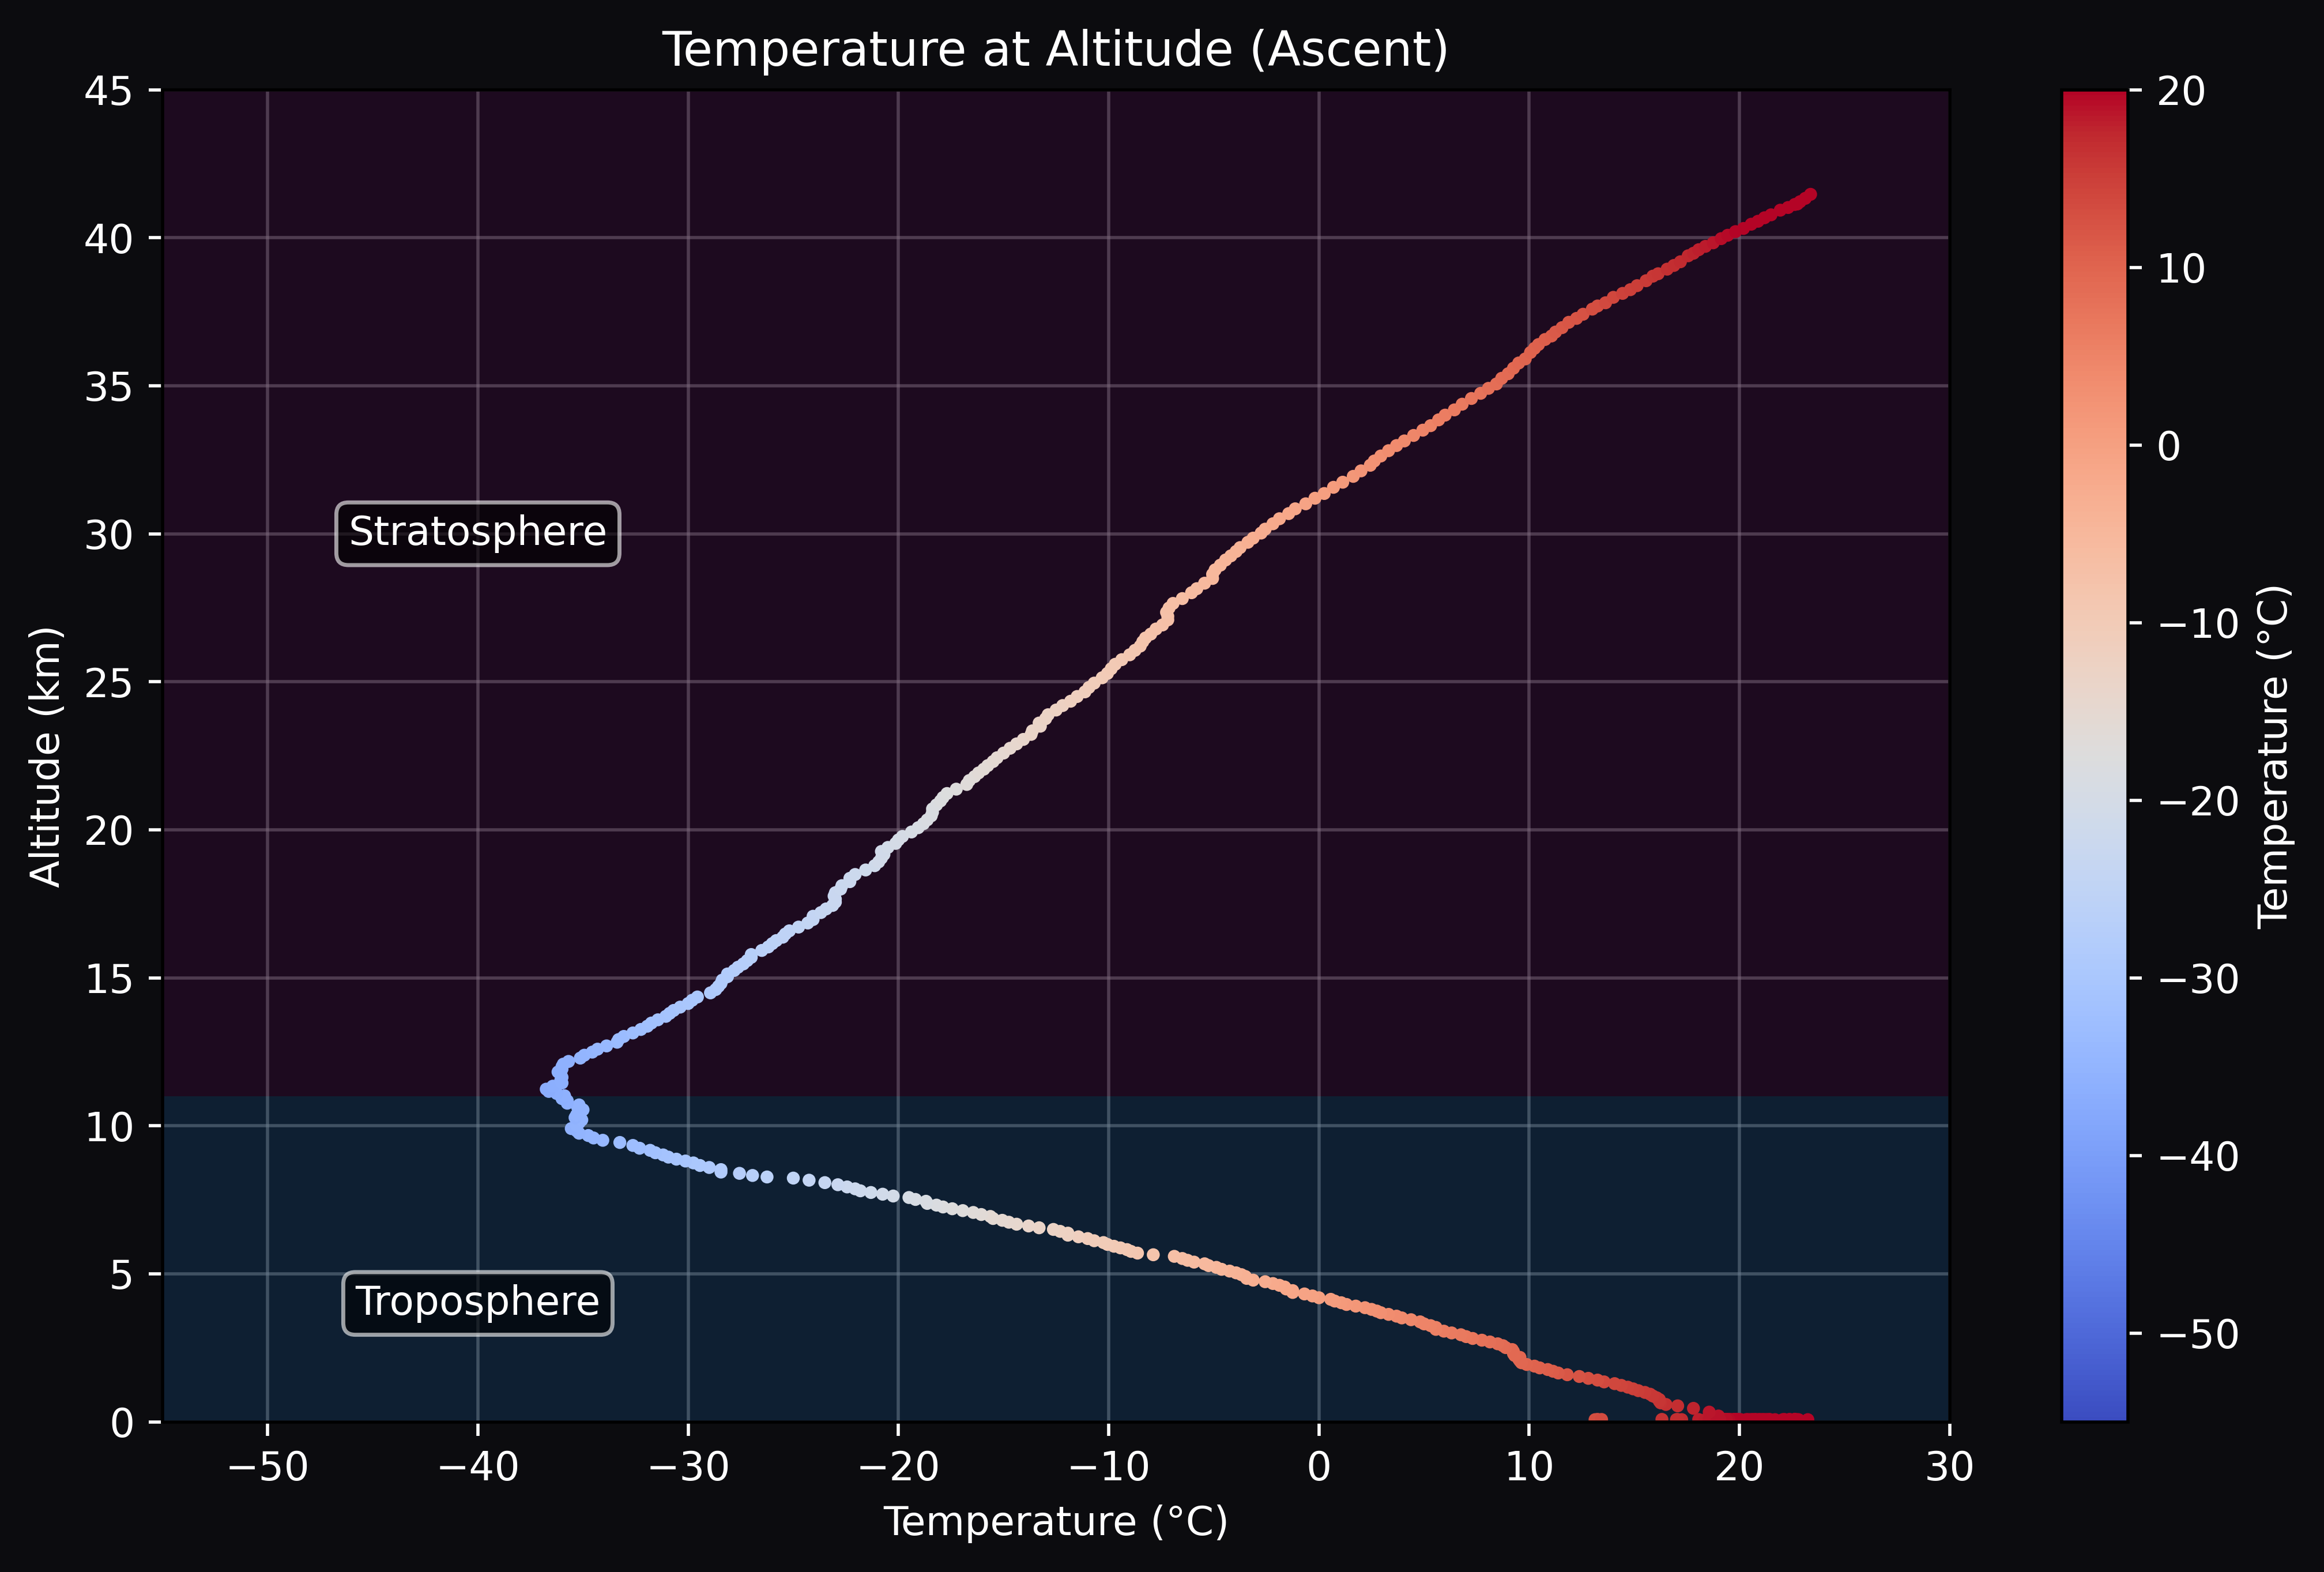
Temperature vs Altitude
Plotting the outside temperature measurements as a function of altitude during the ascent phase shows a nearly inverse linear relation between temperature and altitude up to around $11 \,\mathrm{km}$, after which the temperature begins to increase again. This region is the tropopause, the transition from the troposphere to the stratosphere.2 During this mission, the temperature dropped to a minimum of $-36.75\,^\circ\mathrm{C}$ before rising to $23.38\,^\circ\mathrm{C}$ at the peak of the flight at $41.60 \,\mathrm{km}$.
Ascent rate vs Time
By computing the numerical derivative of the Altitude vs Time data, we obtain the Ascent rate vs Time graph. This clearly show three distinct phases of the mission: the ground phase, the ascent phase, and the descent phase.
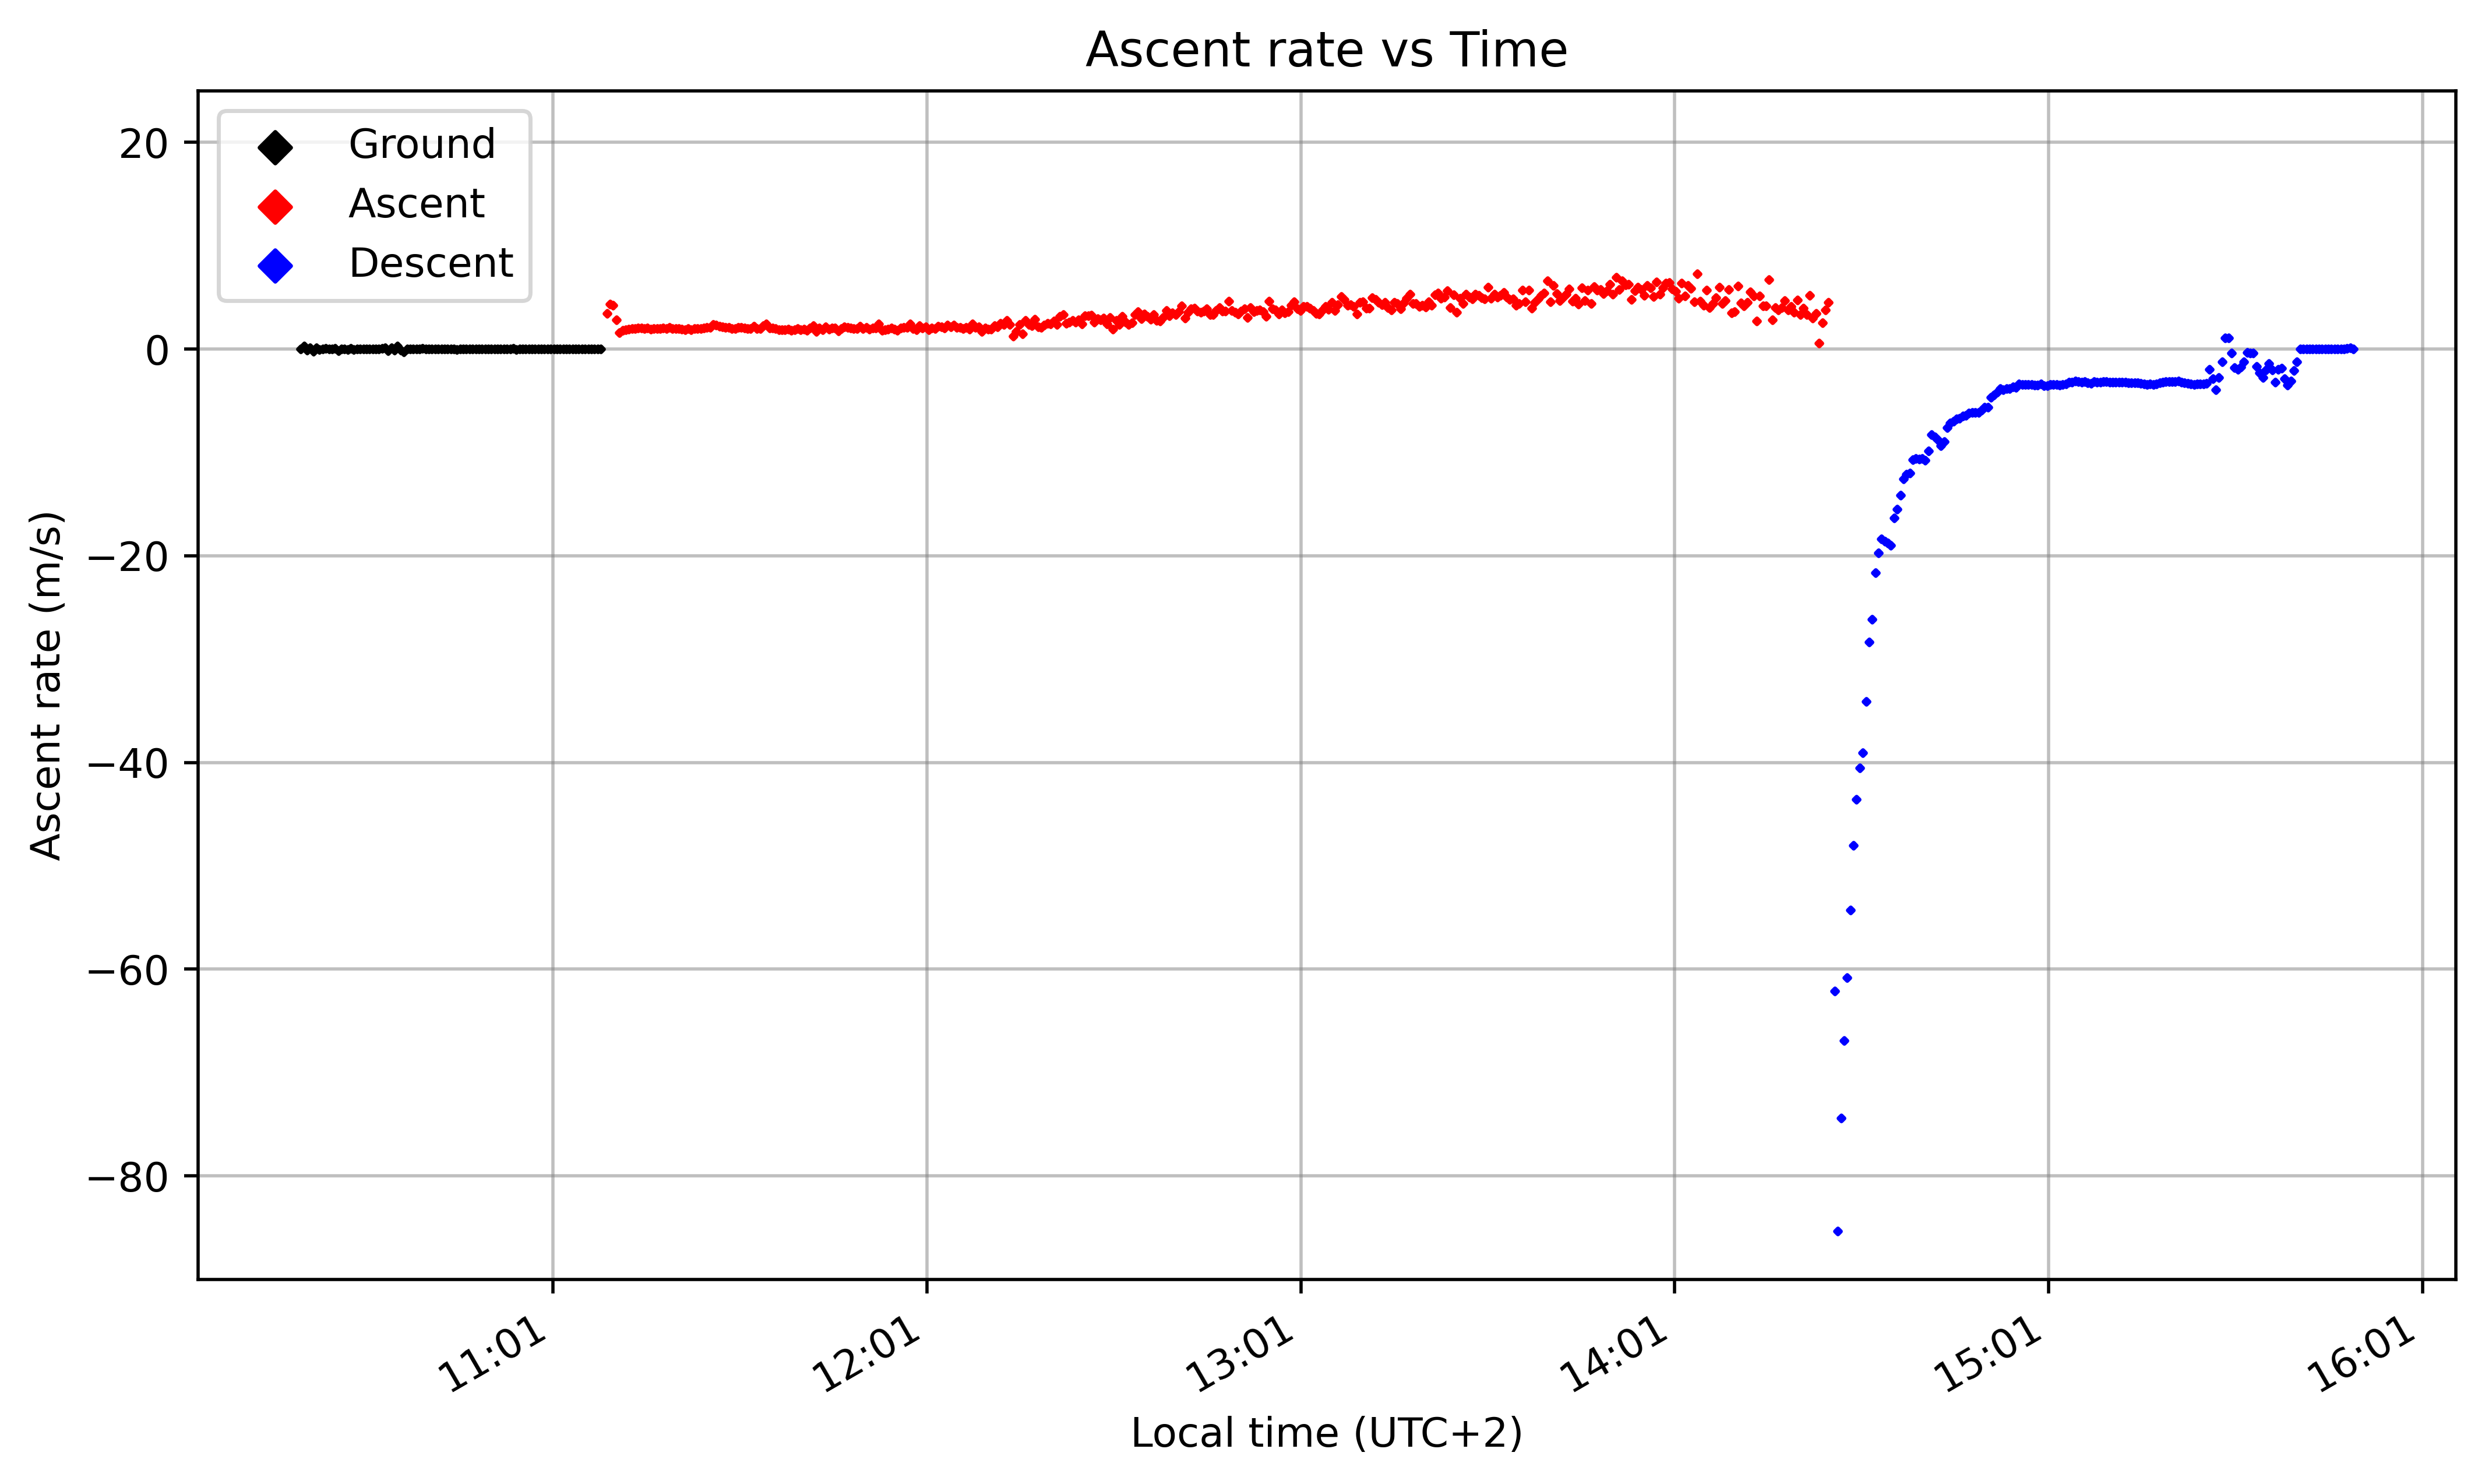
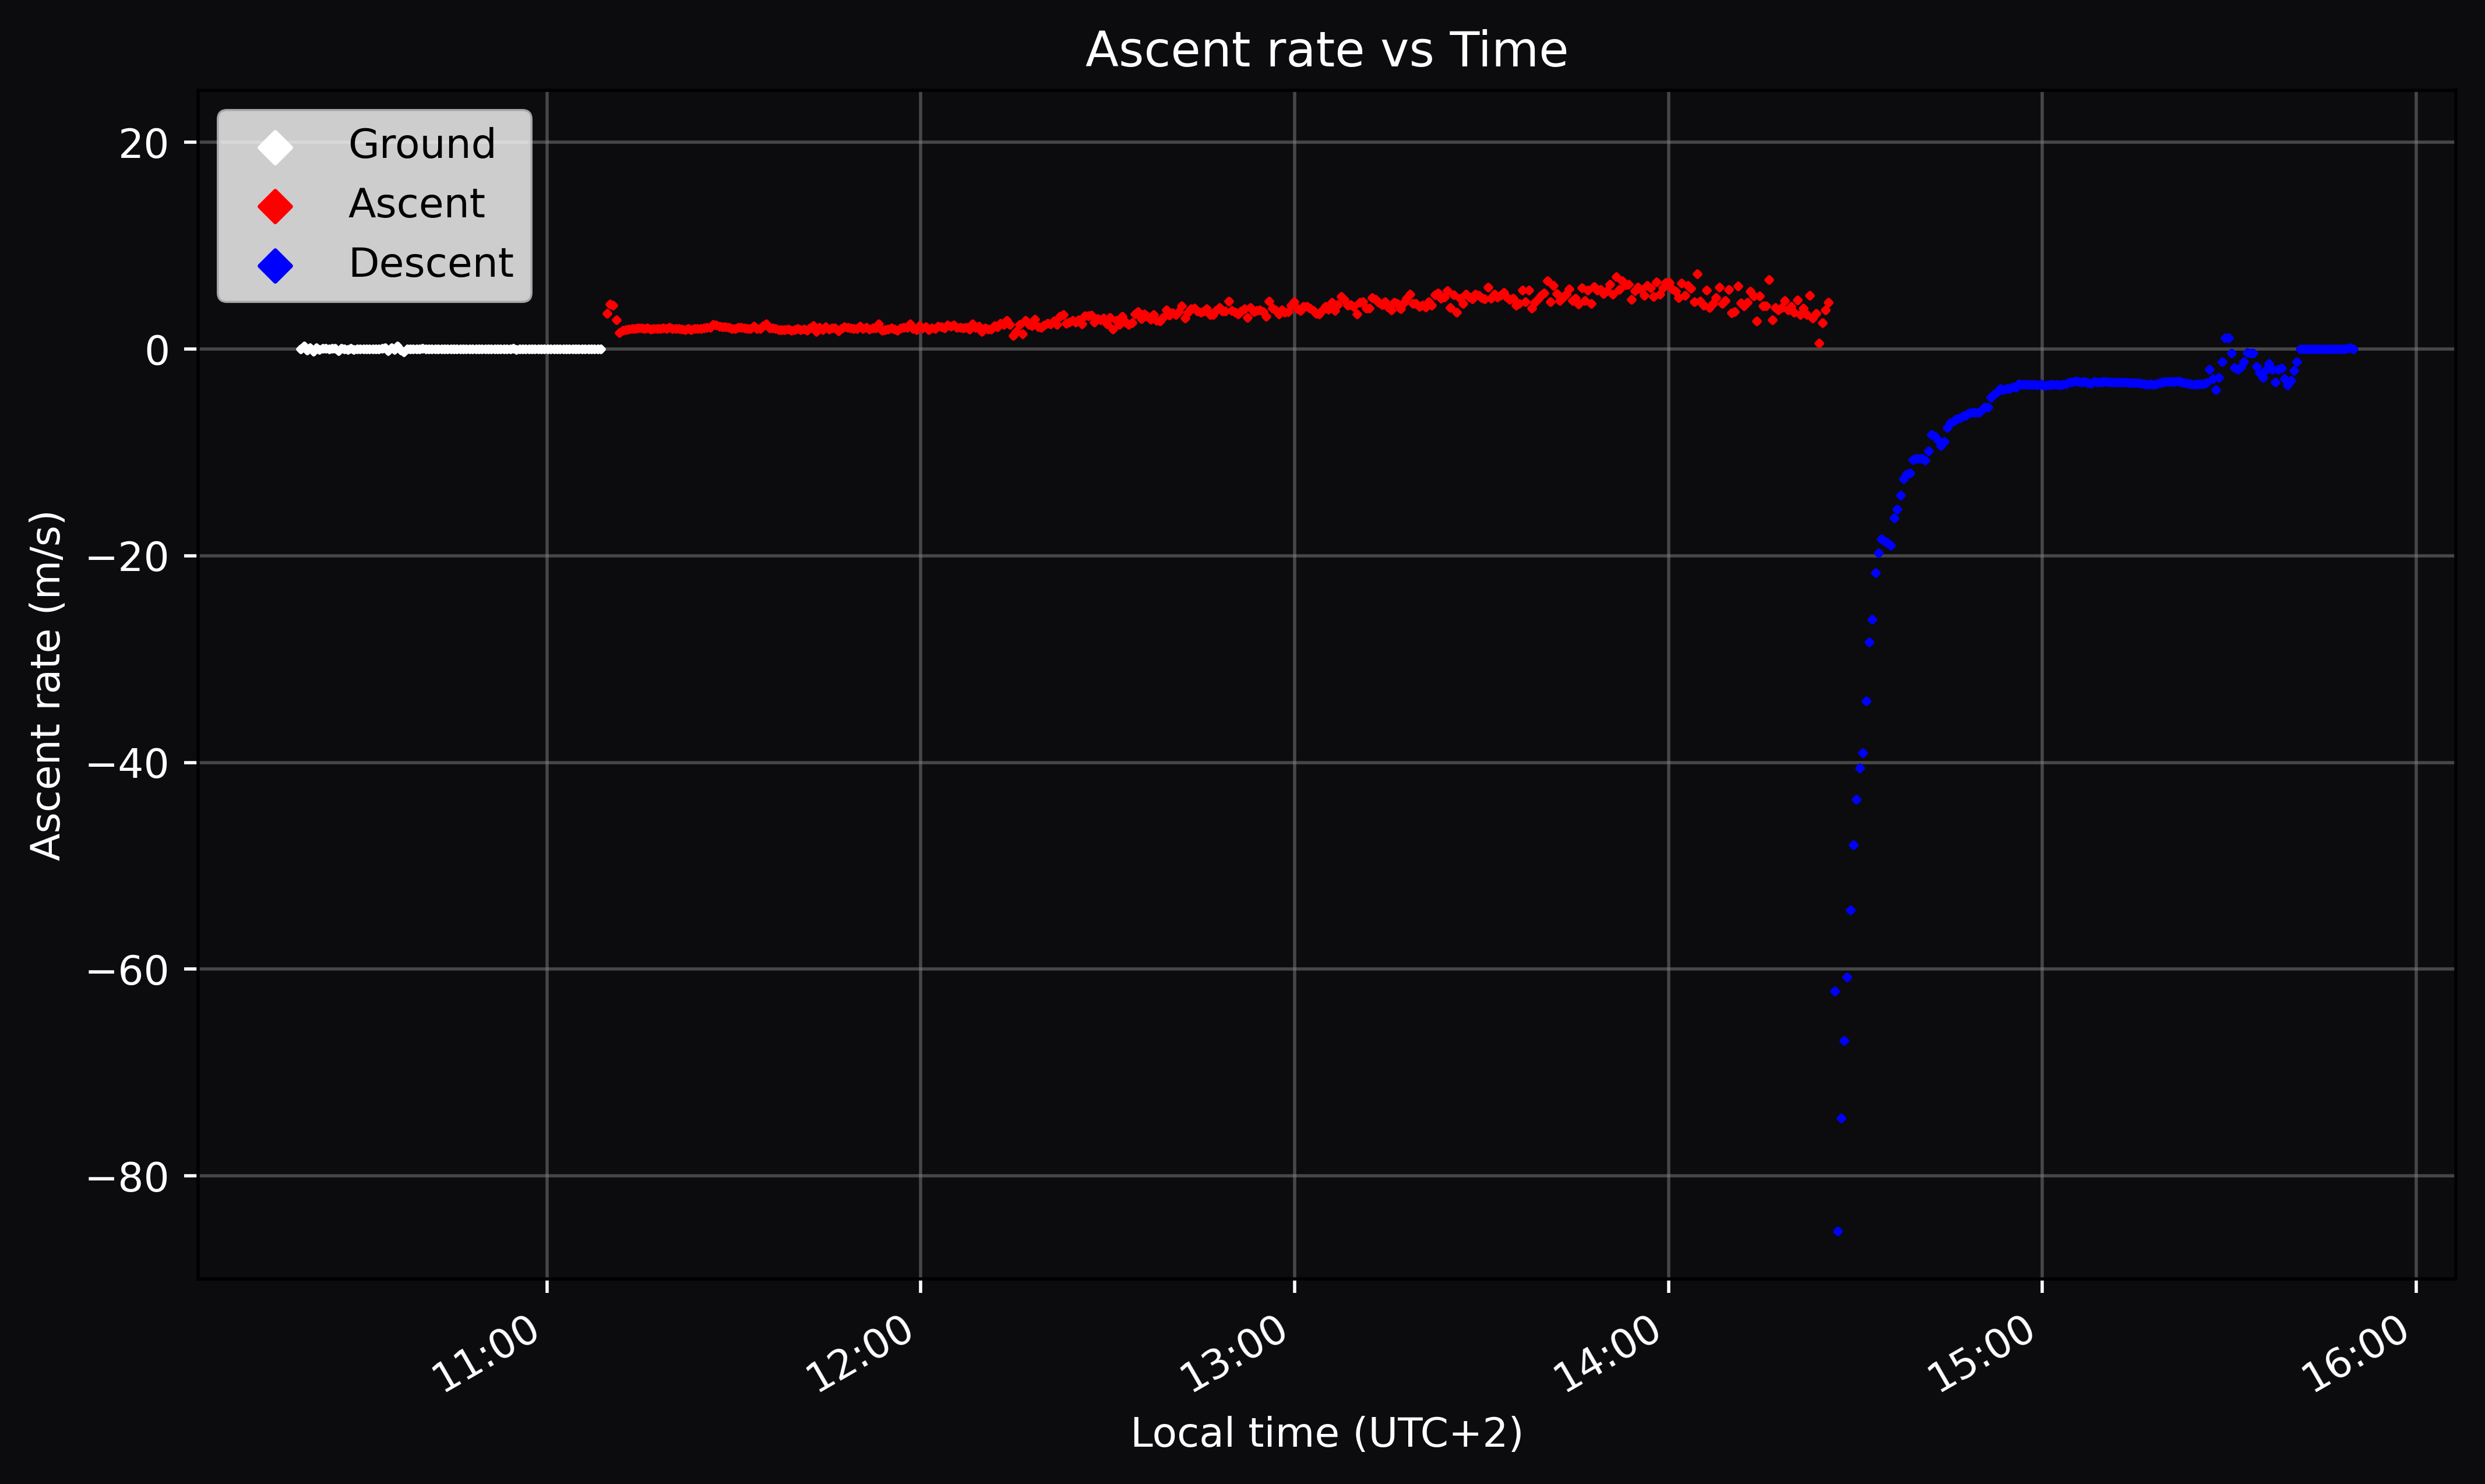
The average ascent rate during the ascent phase is $\approx 3.506\,\mathrm{m/s}$, tending upwards before reaching the peak and after the balloon bursts, accelerating quickly to terminal velocity of $\approx -85.37\,\mathrm{m/s}$.
Recovery
Conclusion
Immediately after launch, it was observed that the APRS telemetry packets did not contain valid GPS coordinates. Subsequent analysis and testing indicated that, in the current configuration, the GPS antenna was obstructed by the thermal blanket wrapped around the gondola, preventing GPS satellite reception.
The Raspberry Pi camera also unfortunately failed to record any images, despite being connected to the power bank. We discovered that to enable dual-port output, the power button must be pressed a second time; otherwise, no power is supplied. This is something to improve upon for the next launch.
But despite the tracking and camera issues, the first launch was a great success. We managed to capture UV spectra as well as temperature and pressure data throughout the entire flight and were able to recover the payload box and parachute.
Many thanks to my teammates Wout Stulens and Achiel Seynhaeve, our partners and volunteers for helping us make this launch mission possible. If you’re interested in the raw data or wish to send an experiment to the stratosphere (preferably high school students), feel free to contact me.
 |   |   |   |  |
Sources
LibreTexts Chemistry. (2023). 2.11: The Barometric Formula. Retrieved from https://chem.libretexts.org/Bookshelves/Physical_and_Theoretical_Chemistry_Textbook_Maps/Thermodynamics_and_Chemical_Equilibrium_(Ellgen)/02%3A_Gas_Laws/2.11%3A_The_Barometric_Formula ↩︎
Layers of the Atmosphere - National Oceanic and Atmospheric Administration. Accessed March 12, 2025. https://www.noaa.gov/jetstream/atmosphere/layers-of-atmosphere ↩︎