Asgard-XII
A student-built payload measuring VOCs, temperature, and pressure in near space, broadcasting live data through APRS launched at the Asgard-XII campaign.

The ASGARD project gives high school students the chance to plan, build, and launch real scientific experiments into near space using high-altitude balloons, combining teamwork with hands-on learning. For an overview of all launches, see the ASGARD project post.
Project
This 12th Asgard edition, Asgard-XII, we are specializing to measure air pollution, VOC’s (Volatile Organic Compounds), temperature and atmospheric pressure using an Adafruit BME680 while transmitting it live to the wireless APRS, Automatic packet retrieval system, network via the Habduino APRS transmitter.
On March 22, the day before the launch we presented our project to the other schools in the planetarium in Brussels. During these presentations, we got to know the projects of the other schools and listened to a lecture by Michaela Brchnelova about magnetohydrodynamics. After the presentation of the projects by the various groups, which also included Portuguese and British students.
Launch
This year, on the 23th of March, I had the unique opportunity to release the stratospheric balloon myself and let it lift into the skies, an unforgettable experience! Special thanks to Asgard campaign manager Erik de Schrijver who kindly allowed me to take on this unique role.
Results
Our experiment successfully transmitted telemetry and sensor data throughout the entire flight via APRS, providing complete records of GPS coordinates, temperature, pressure, gas resistance, and altitude. Once the gondola was recovered, we verified the data integrity and spent the evening (and far too much of the night) processing and visualizing the results.
The graphs clearly show how environmental conditions change with altitude during the flight: temperature and pressure decreased with altitude, while gas resistance, representing the “cleanness of air”, shows regions of higher and lower concentration volatile organic compounds. By morning, we had prepared a comprehensive presentation for our fellow students and teachers, showcasing our visualized data and reporting on the success of our mission (which is not always a given in this kind of scientific endeavor).
Volatile organic compounds (VOC’s)
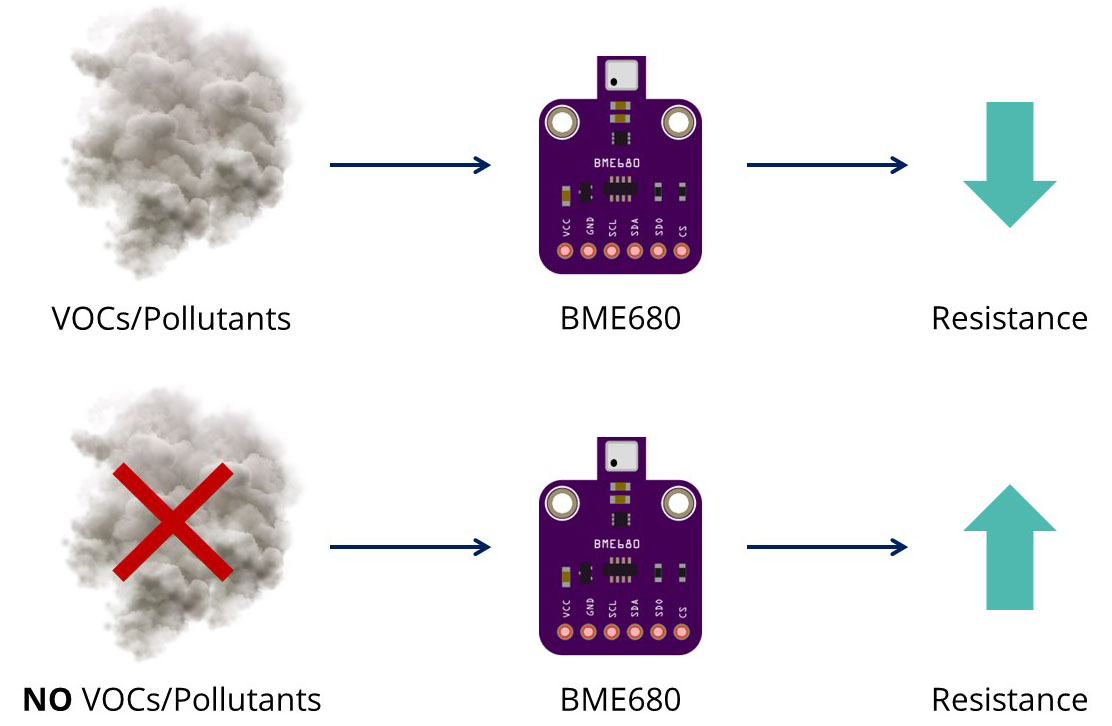
If the gas inside the sensor contains few VOC’s, the measured resistance will be higher as there are fewer particles in the air through which current can flow, similarly if the air is contaminated with VOC’s the resistance will be low as there are many particles to conduct current through.
 Source: randomnerdtutorials.com
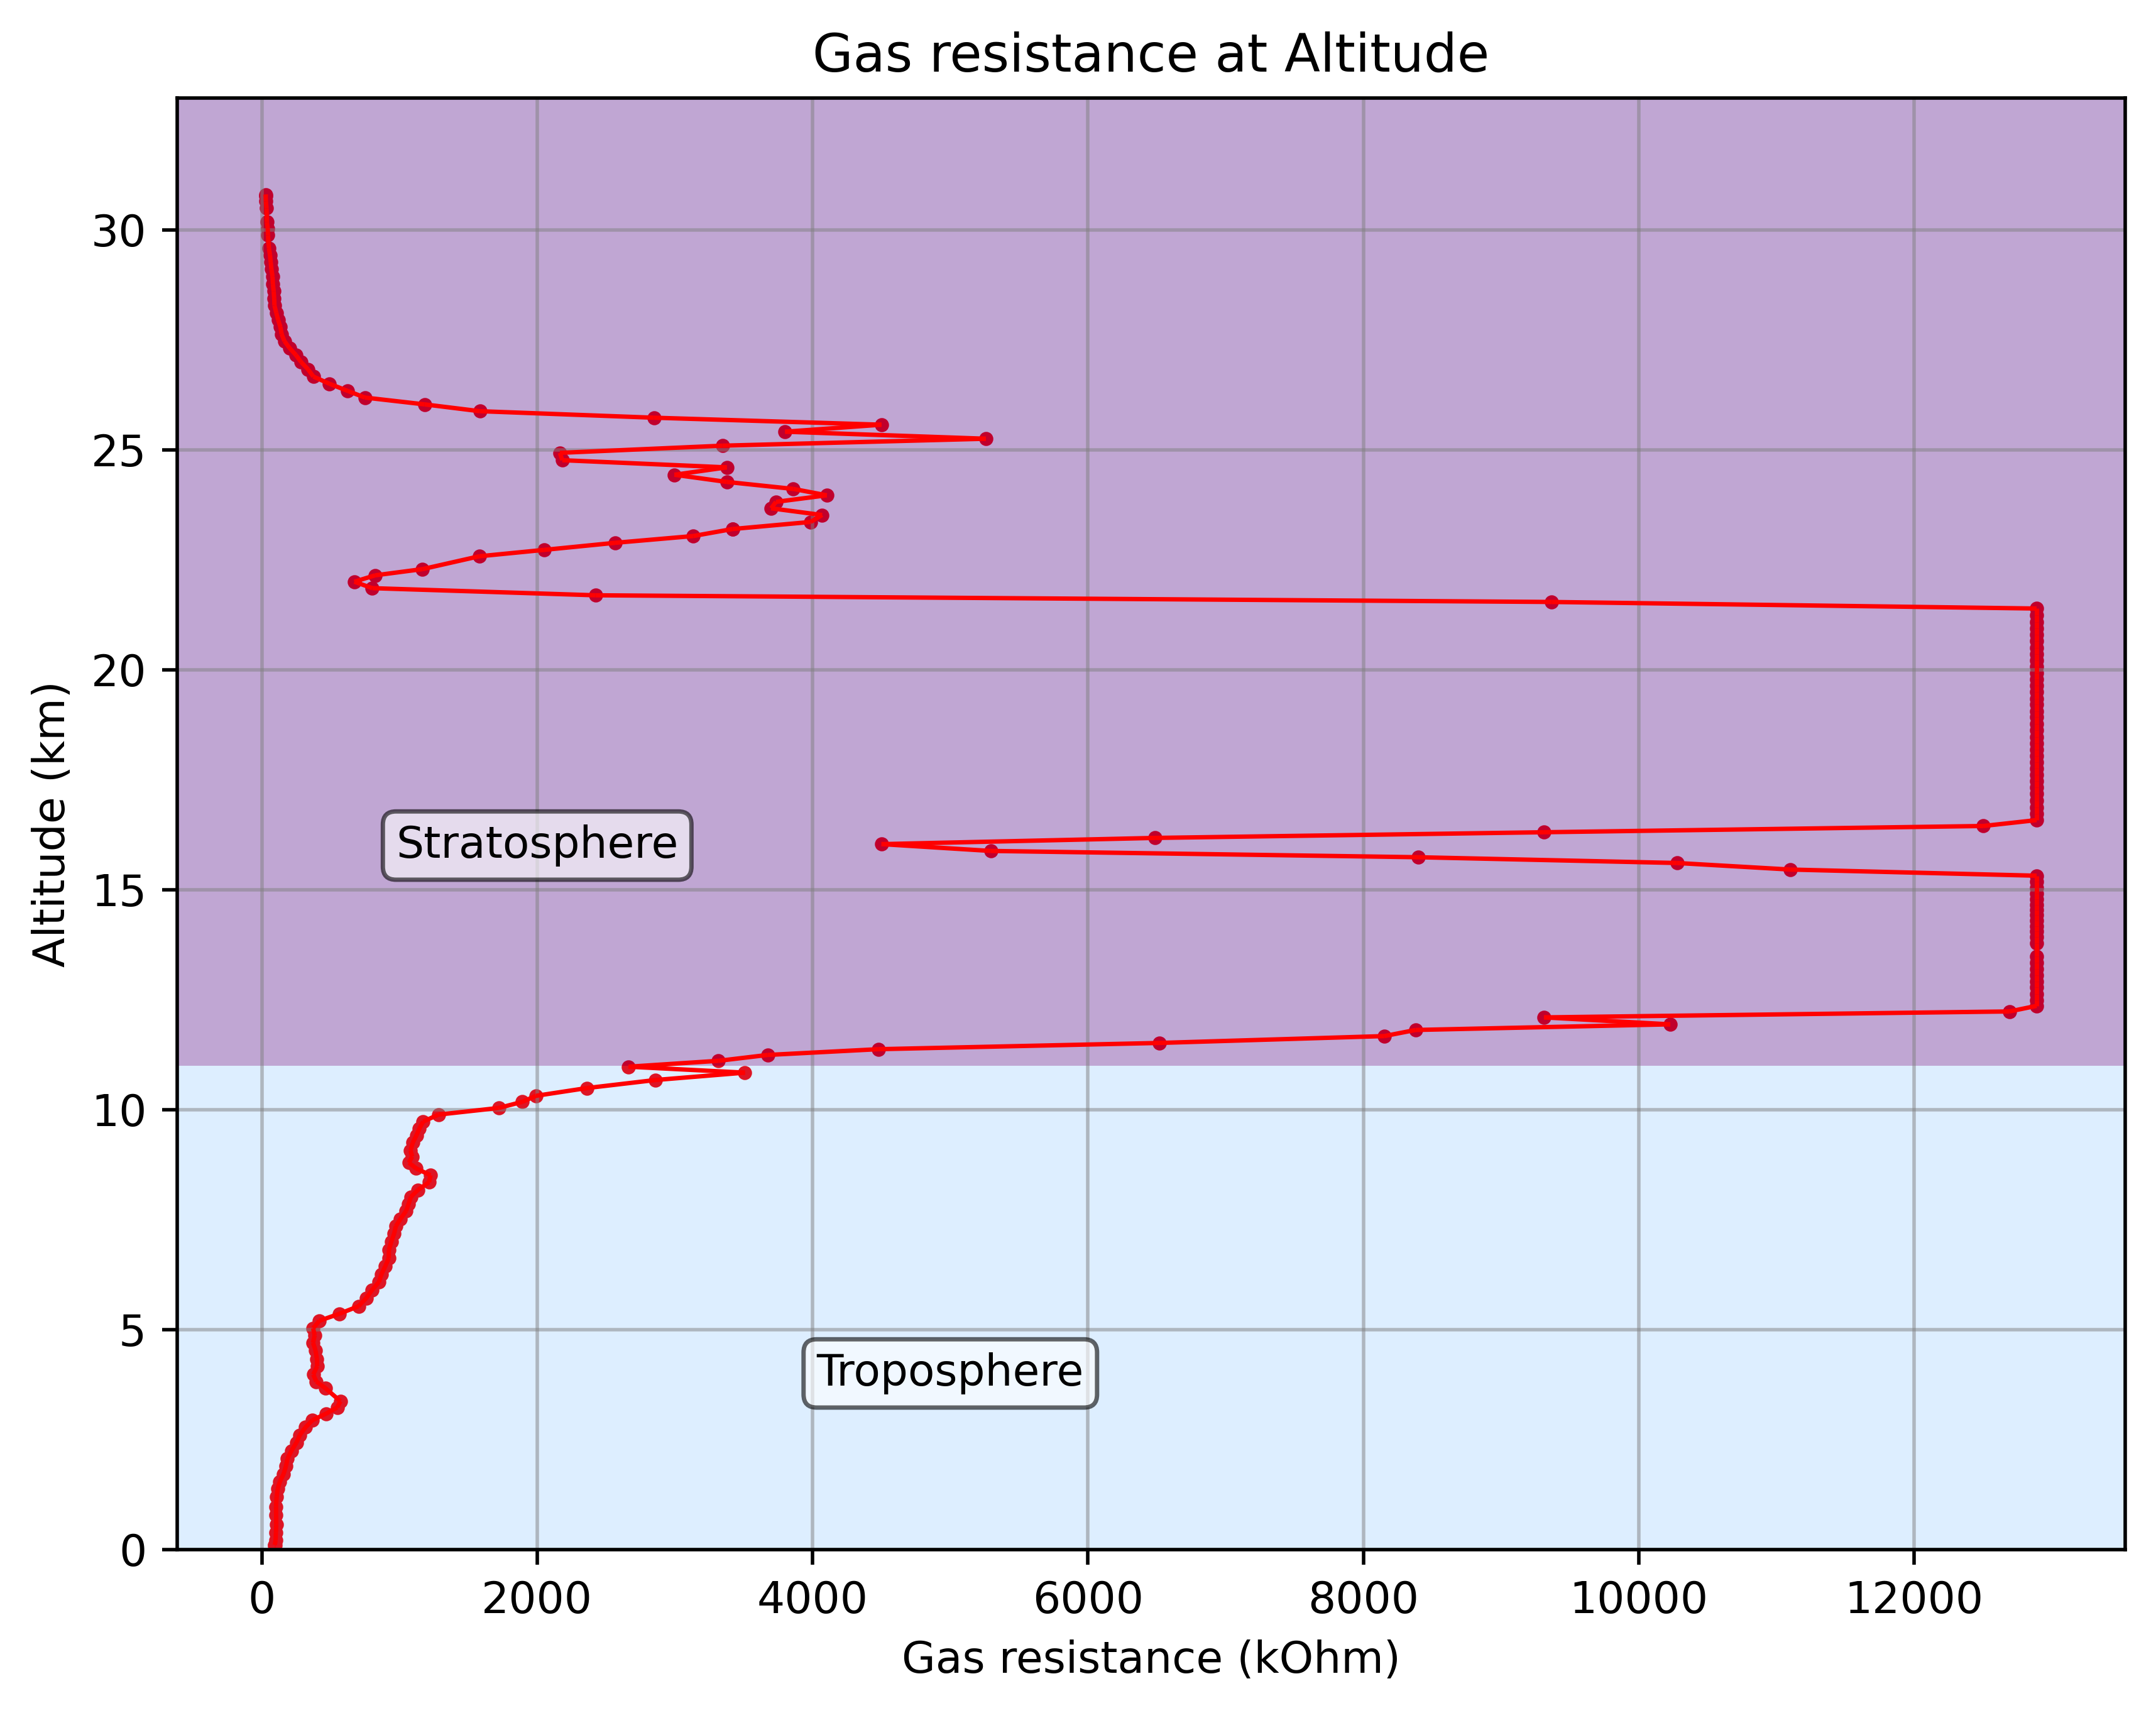
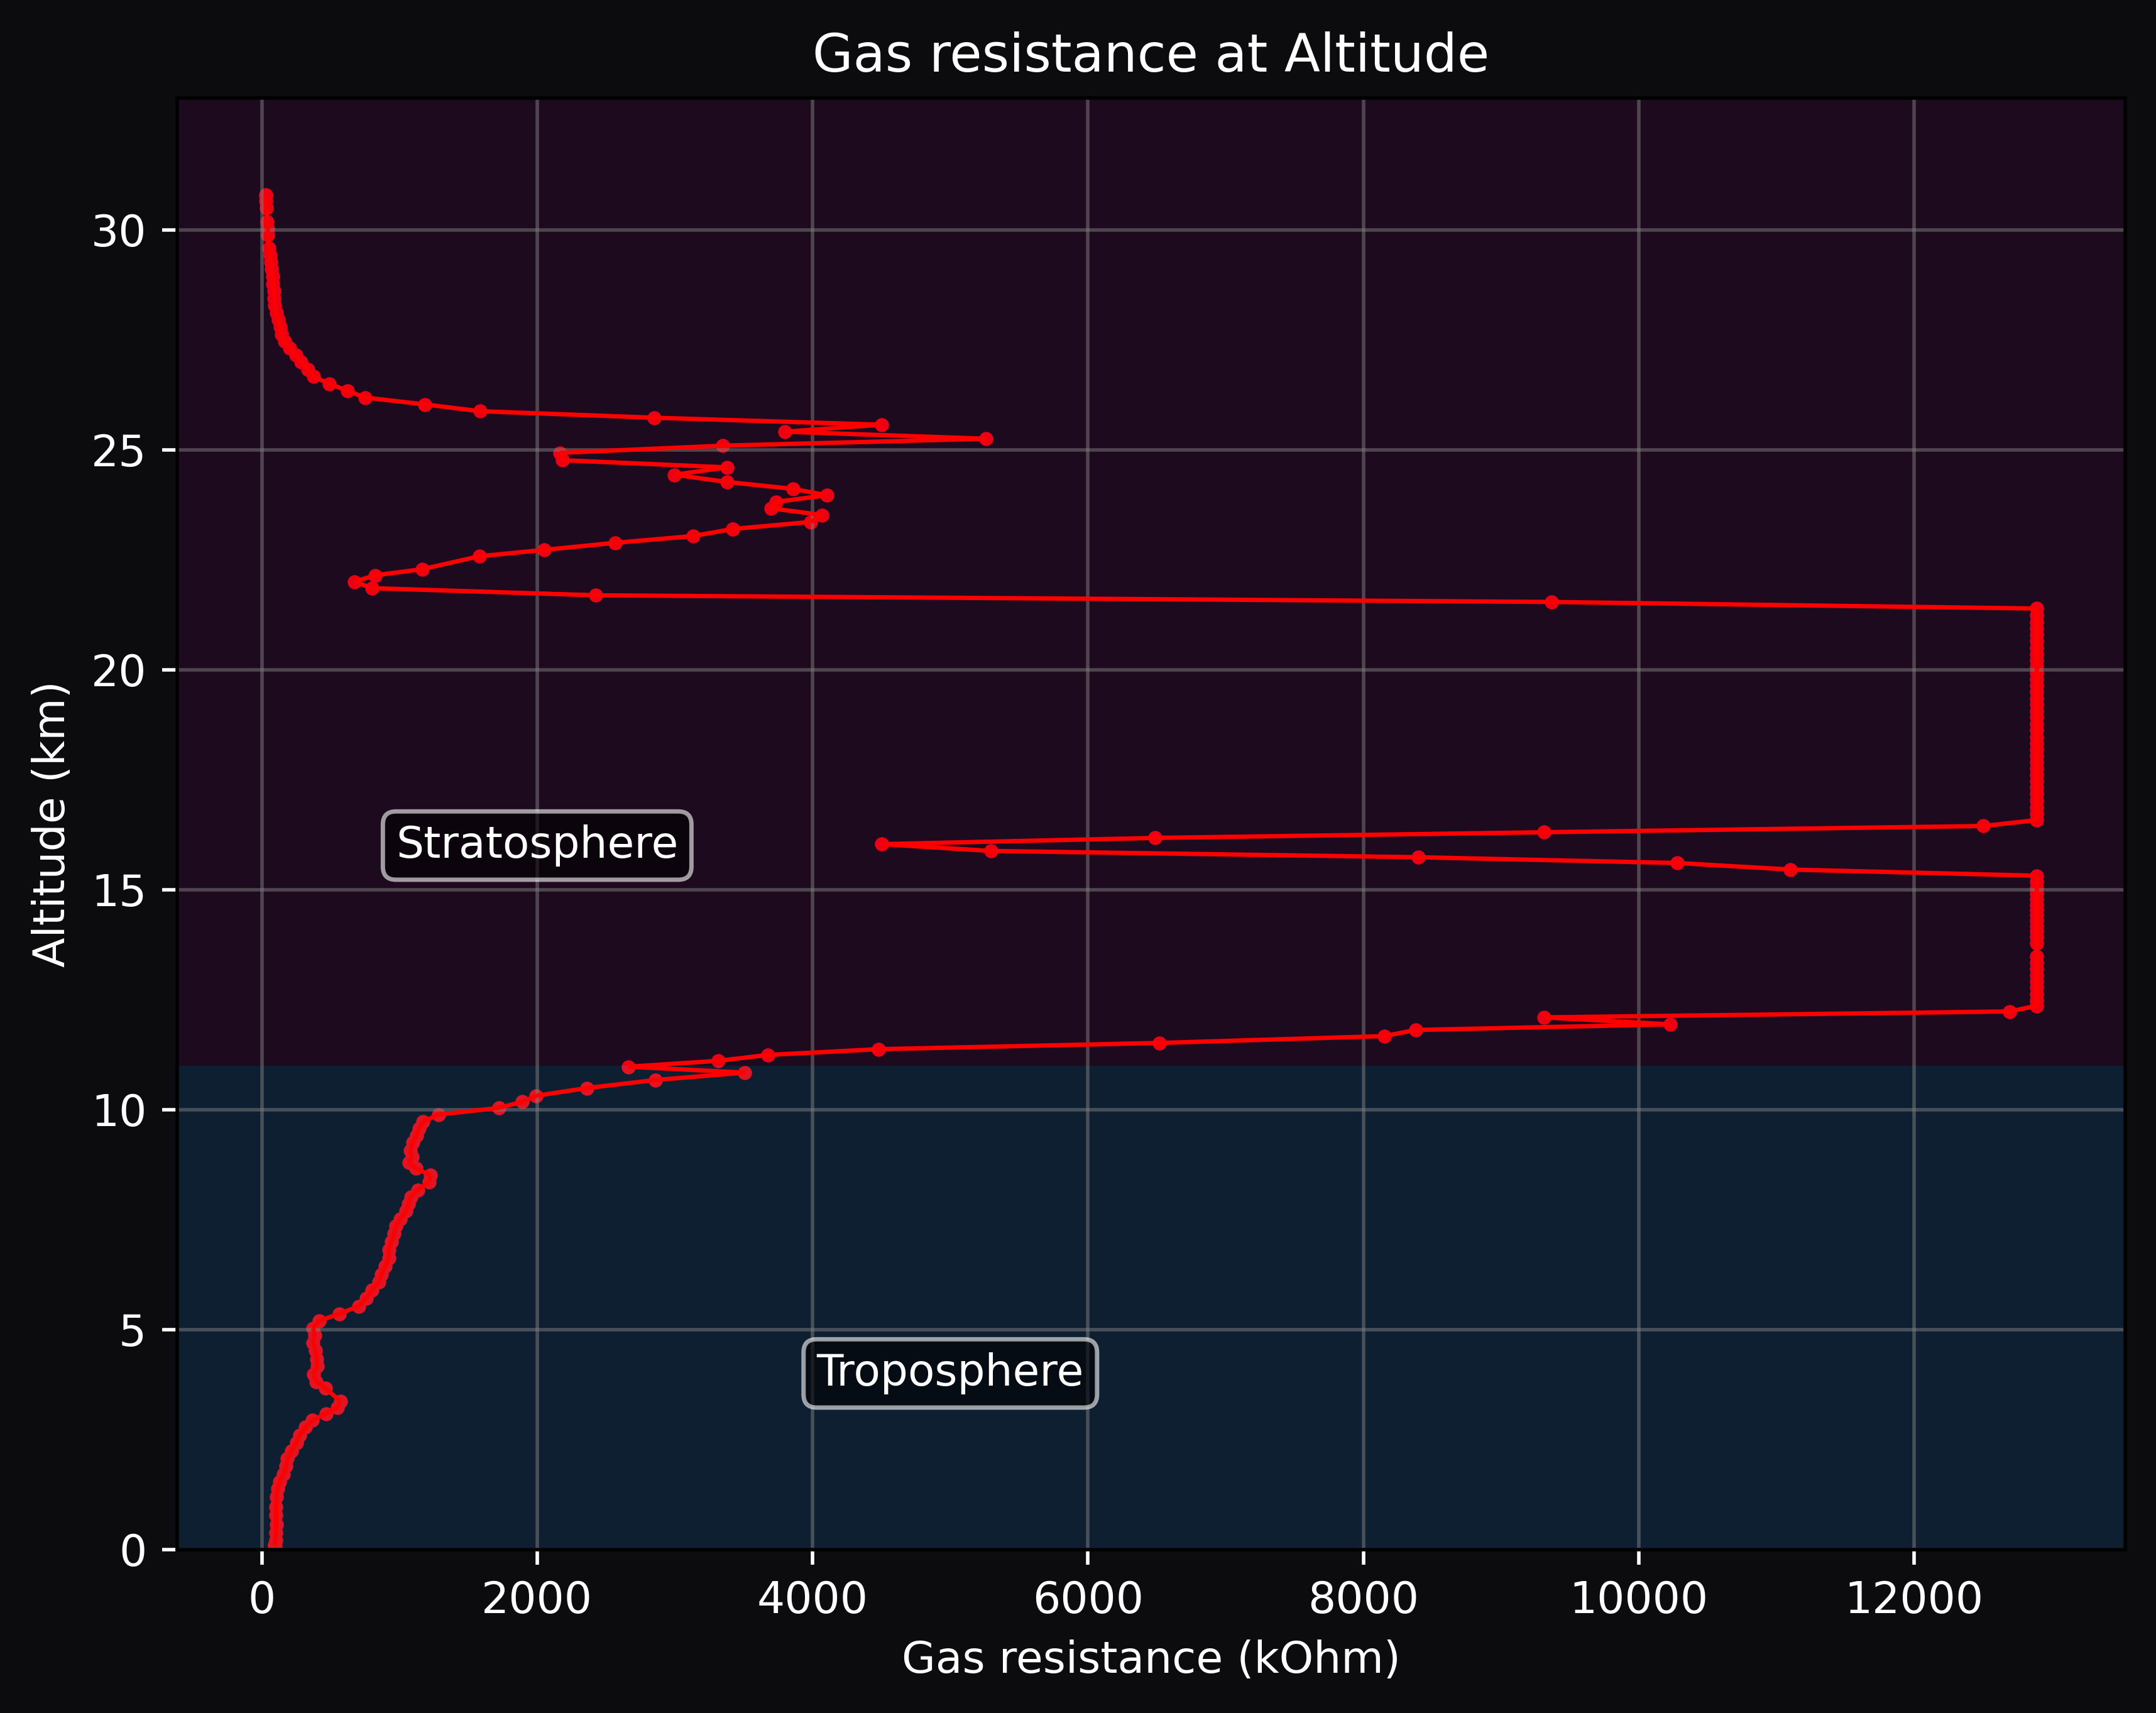
During flight it can be seen that there are particular bands of the troposphere and atmosphere in which there are many volatile organic compounds present, at ground level the gas resistance is quite low, being in an urban environment such Brussels can explain the many fine particles present in the air. Many complex phenomena such as the Ozone layer or $\mathrm{NO}_x$ emissions contribute to the sharp peaks and valleys in the graph which make it difficult to hypothesize the exact cause for each band.
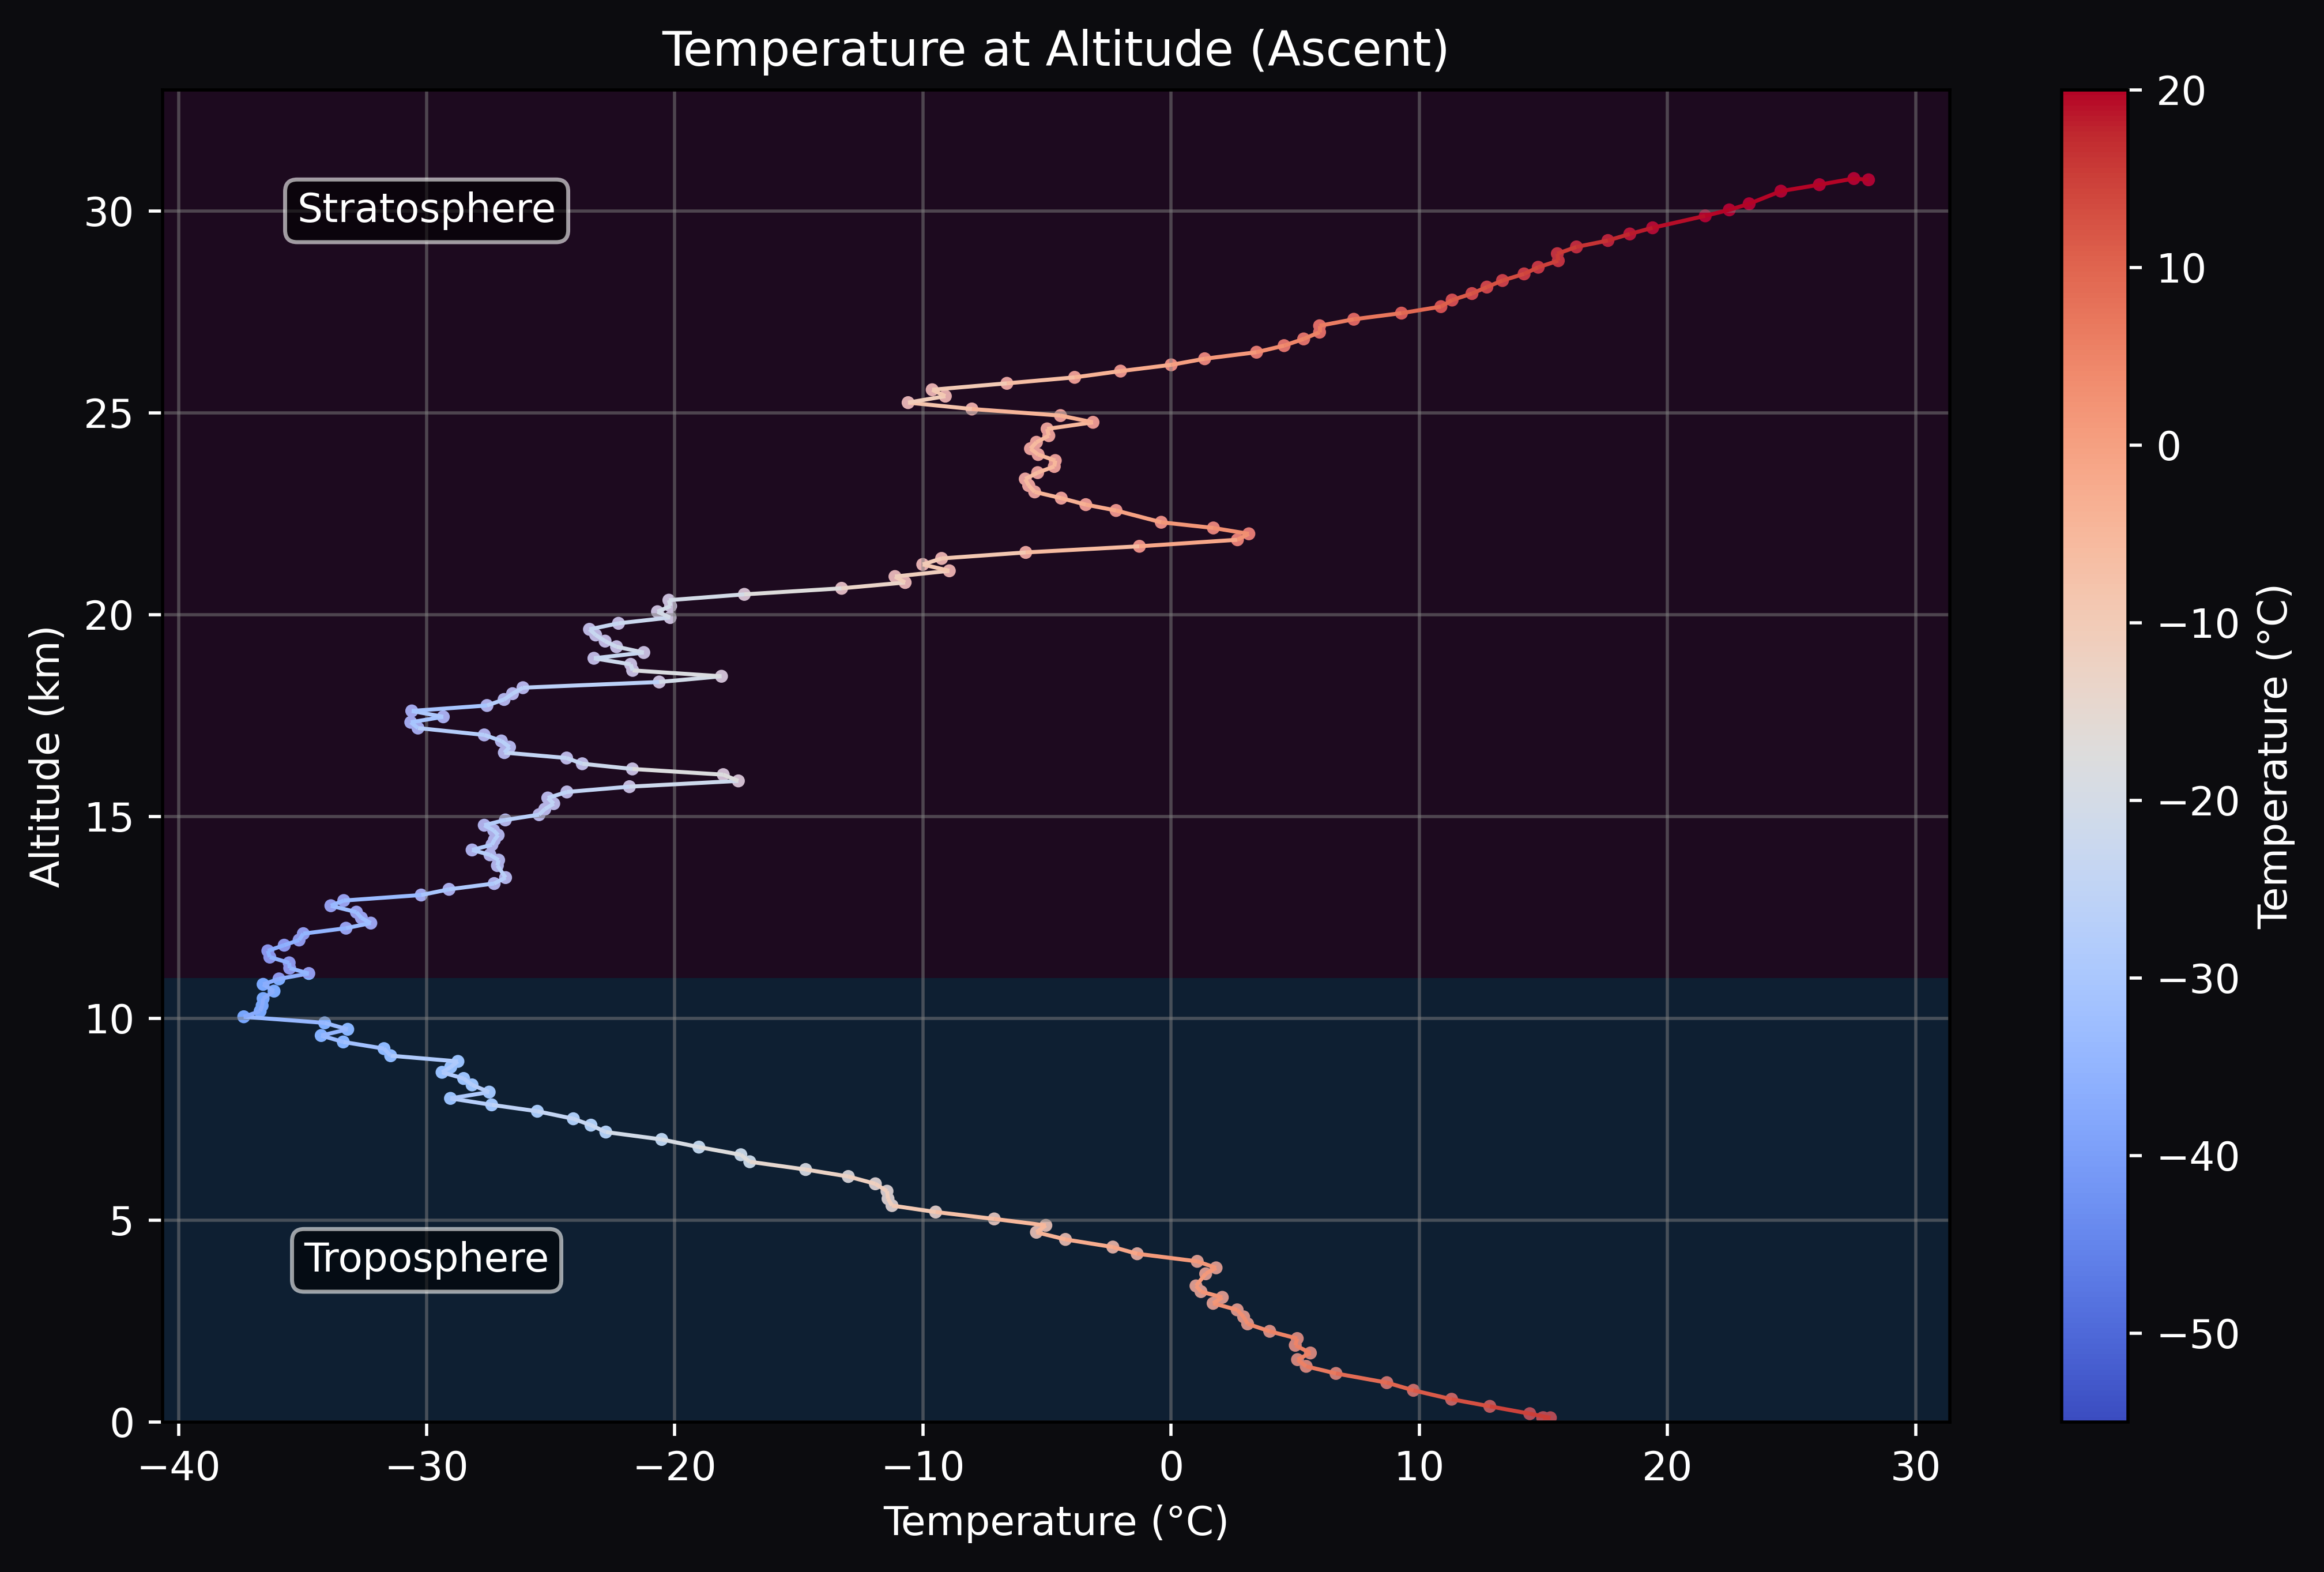
Temperature vs GPS Altitude
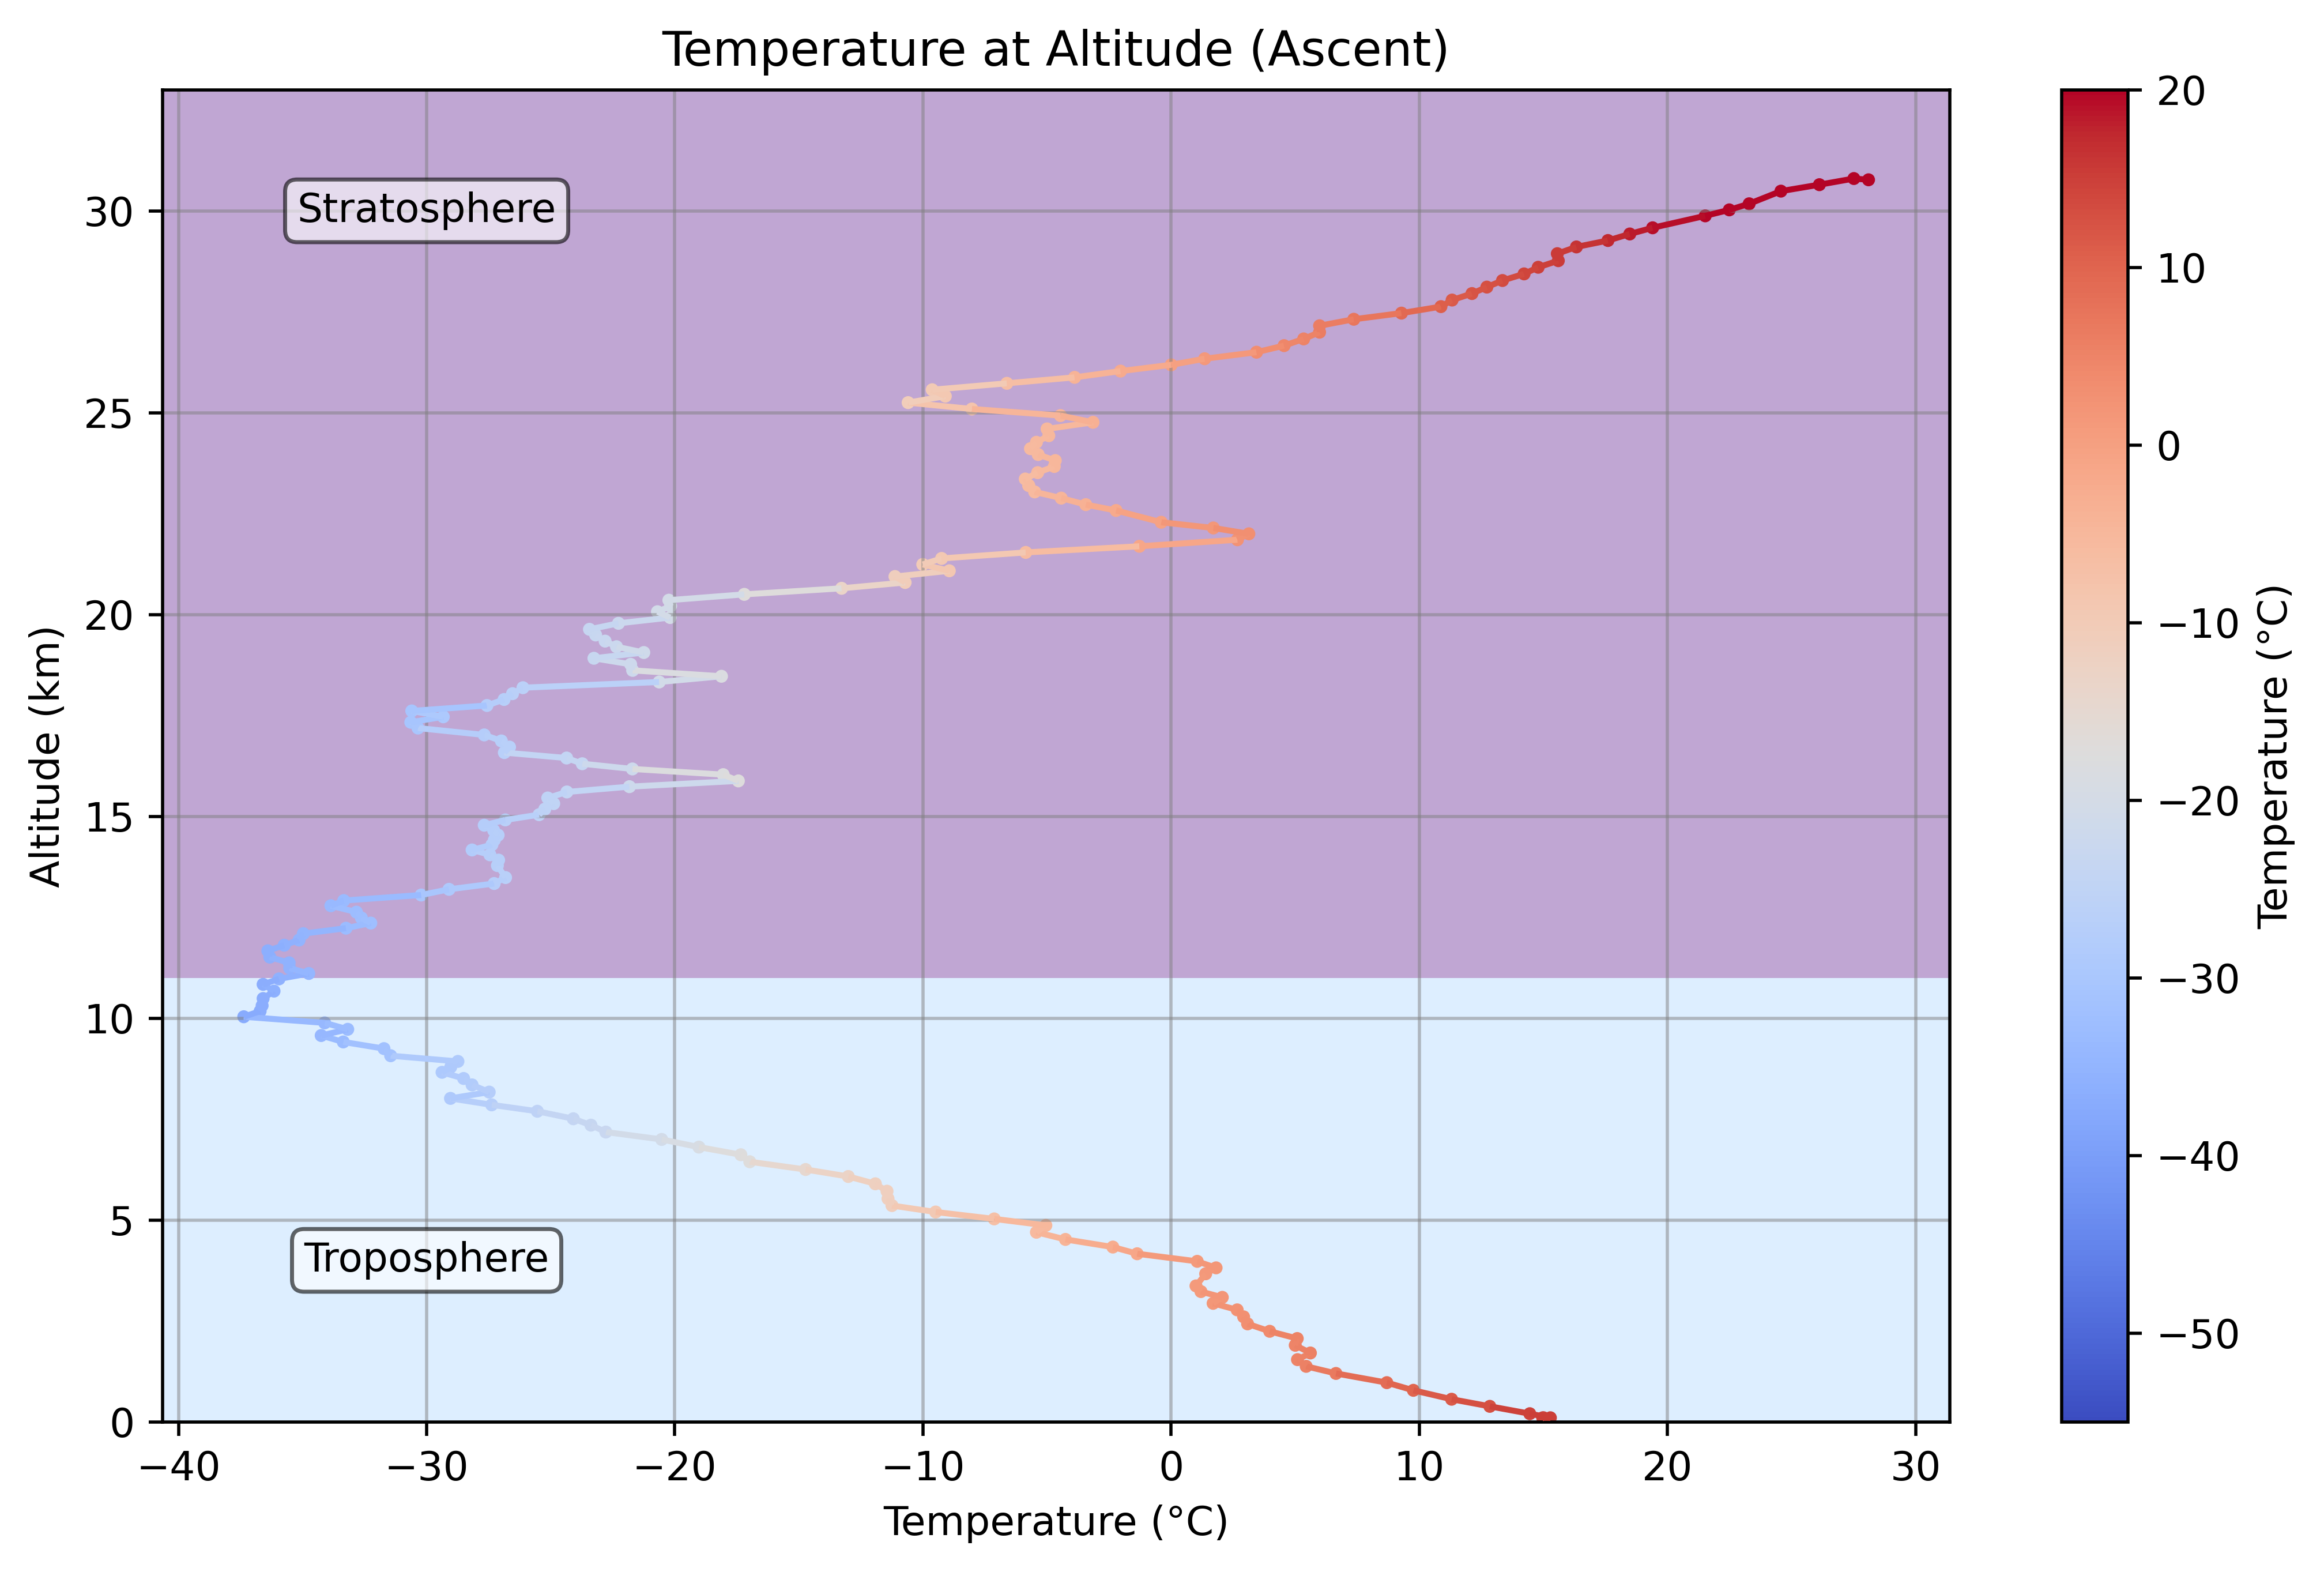
When the outside temperature measurements is plotted in function of the altitude during the ascent phase, it shows a nearly inverse linear relation between temperature and altitude until an altitude of around $11 \,\mathrm{km}$ after which temperature starts increase again. This is the tropopause, a transition layer from troposphere, the layer in which 99.9% of people live and breathe, to the stratosphere, the atmospheric layer in which most long-distance airline flights are flown.
This mission recorded a lowest temperature of $-37.37\,^\circ\mathrm{C}$ at altitude of $10.04 \,\mathrm{km}$, while on the flight’s peak the temperature reached a warm $28.1\,^\circ\mathrm{C}$ at $30.769 \,\mathrm{km}$. The means that at there are parts of the atmosphere that can be warmer than the surface temperature (on this day it was $\approx 15\,^\circ\mathrm{C}$). This means the temperature difference between the coldest and hottest regions of the atmosphere on this particular day was $65.47\,^\circ\mathrm{C}$.
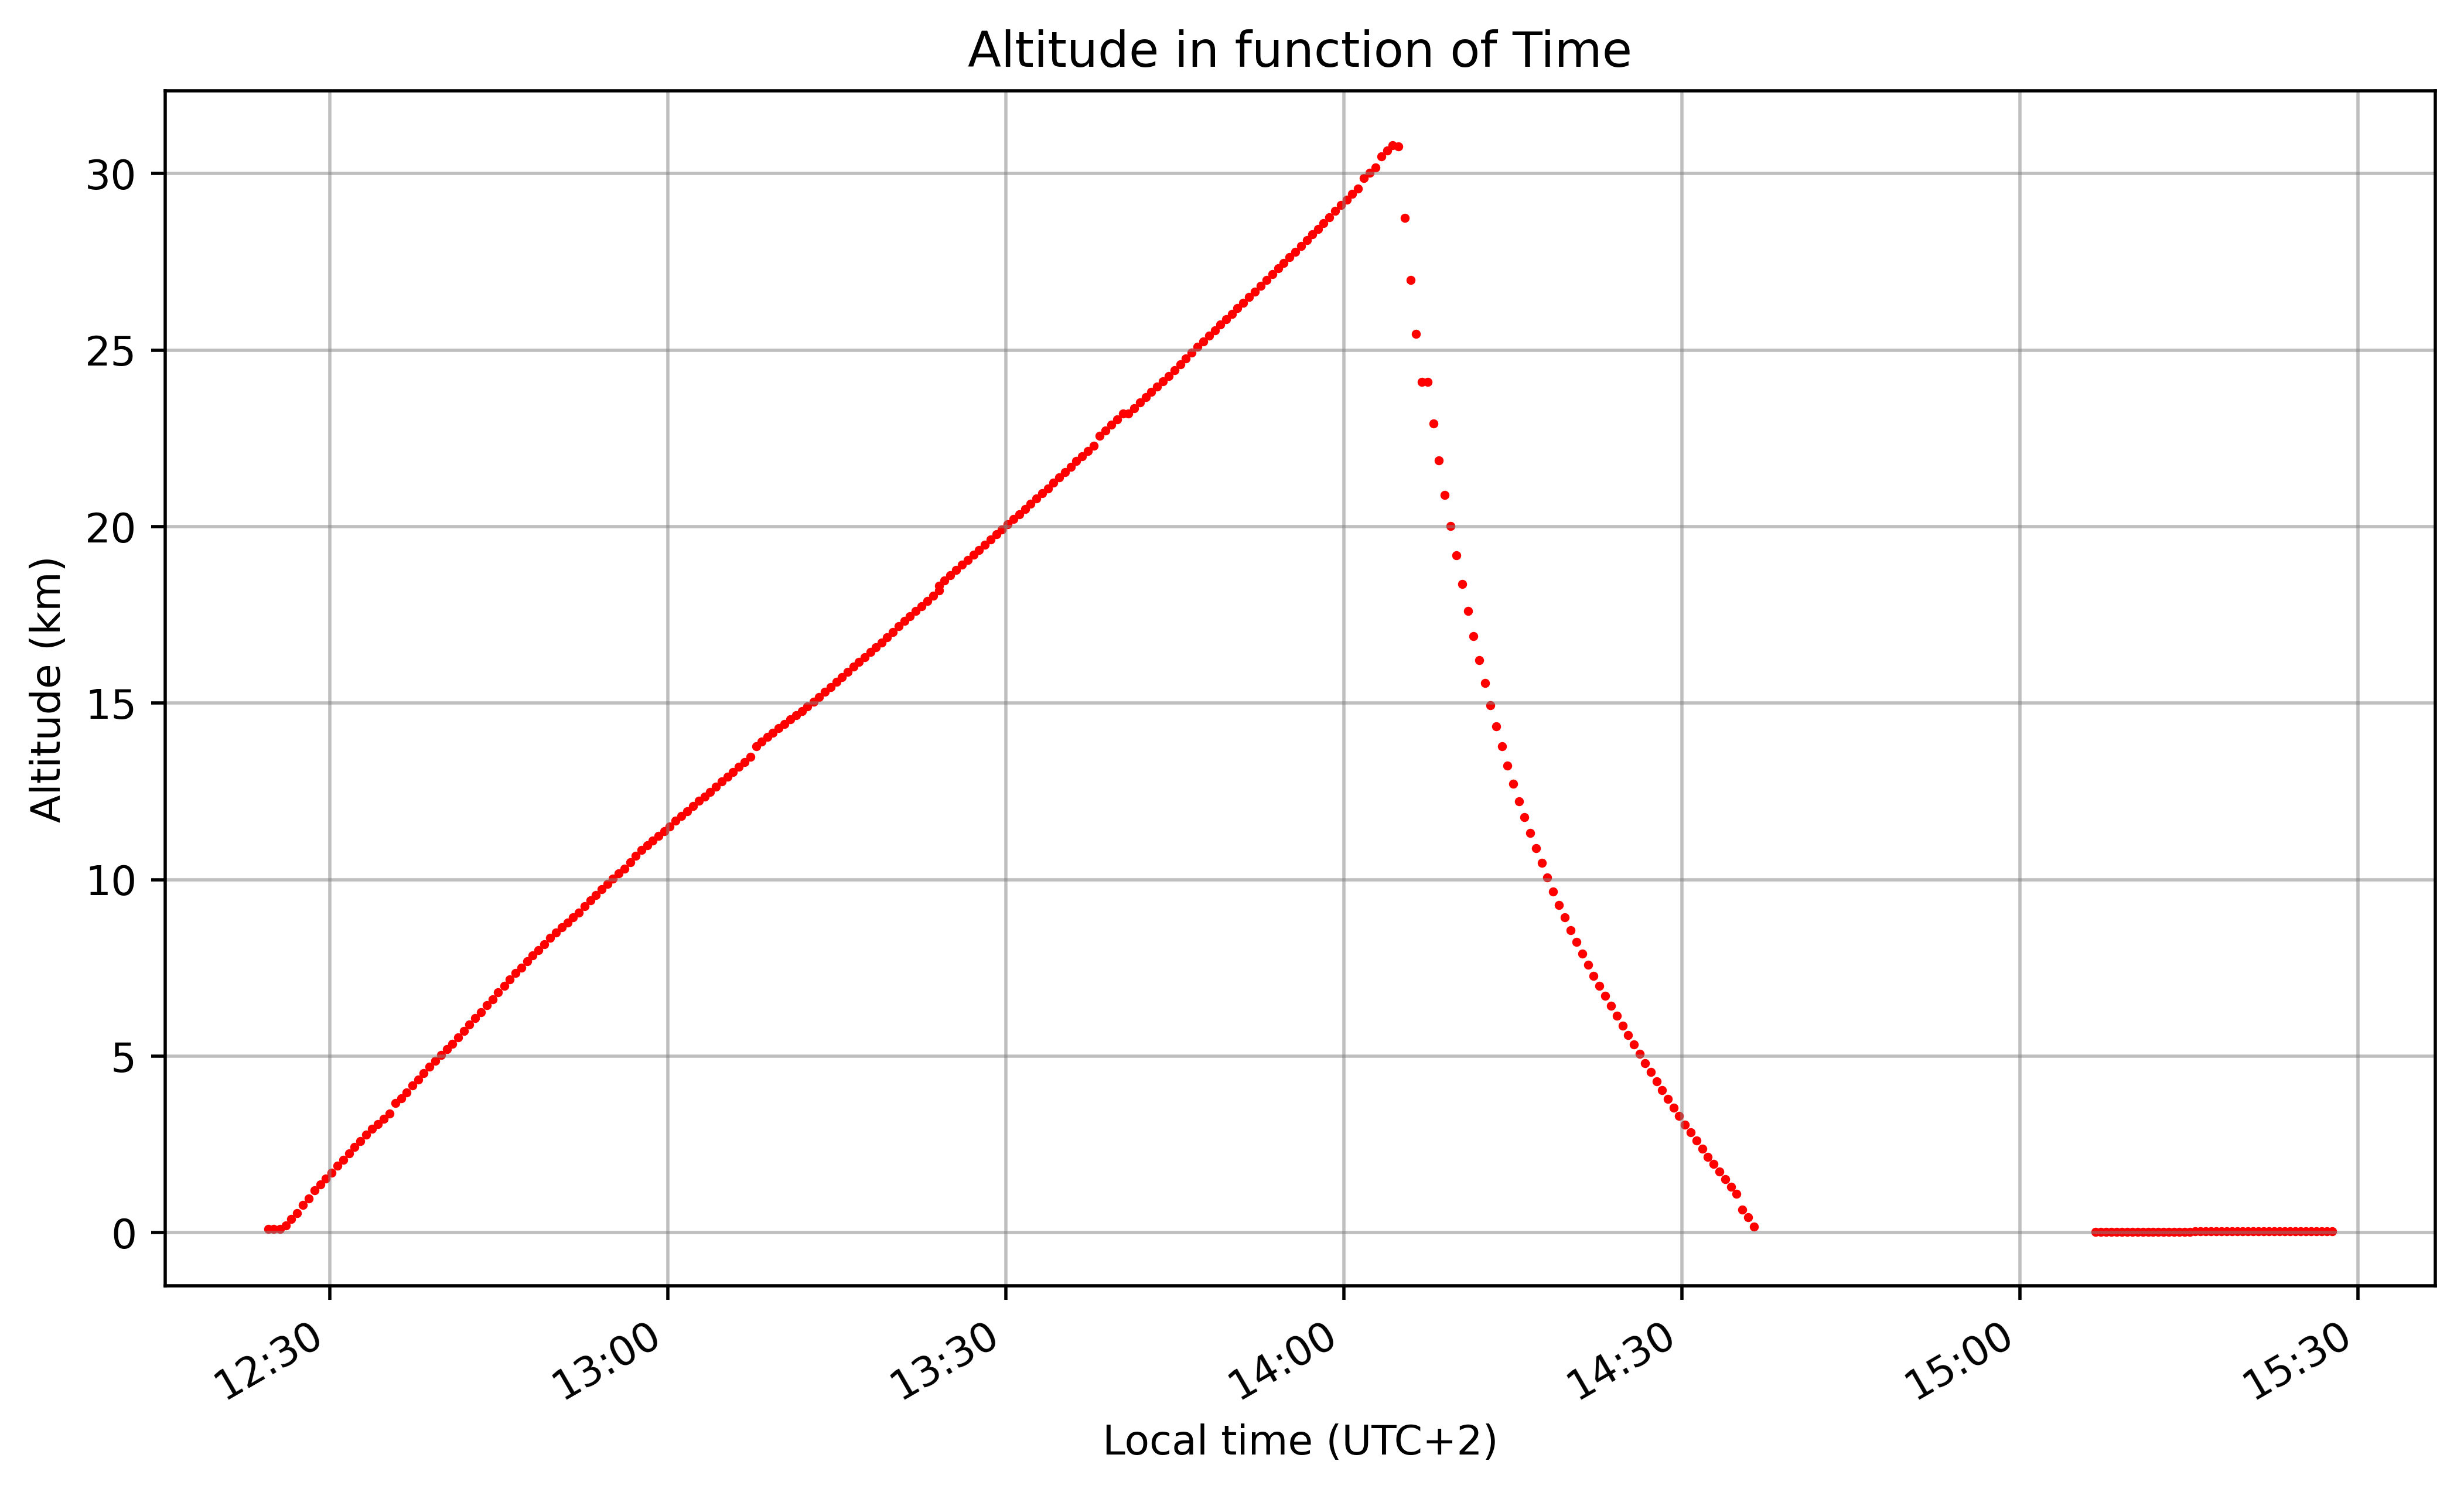
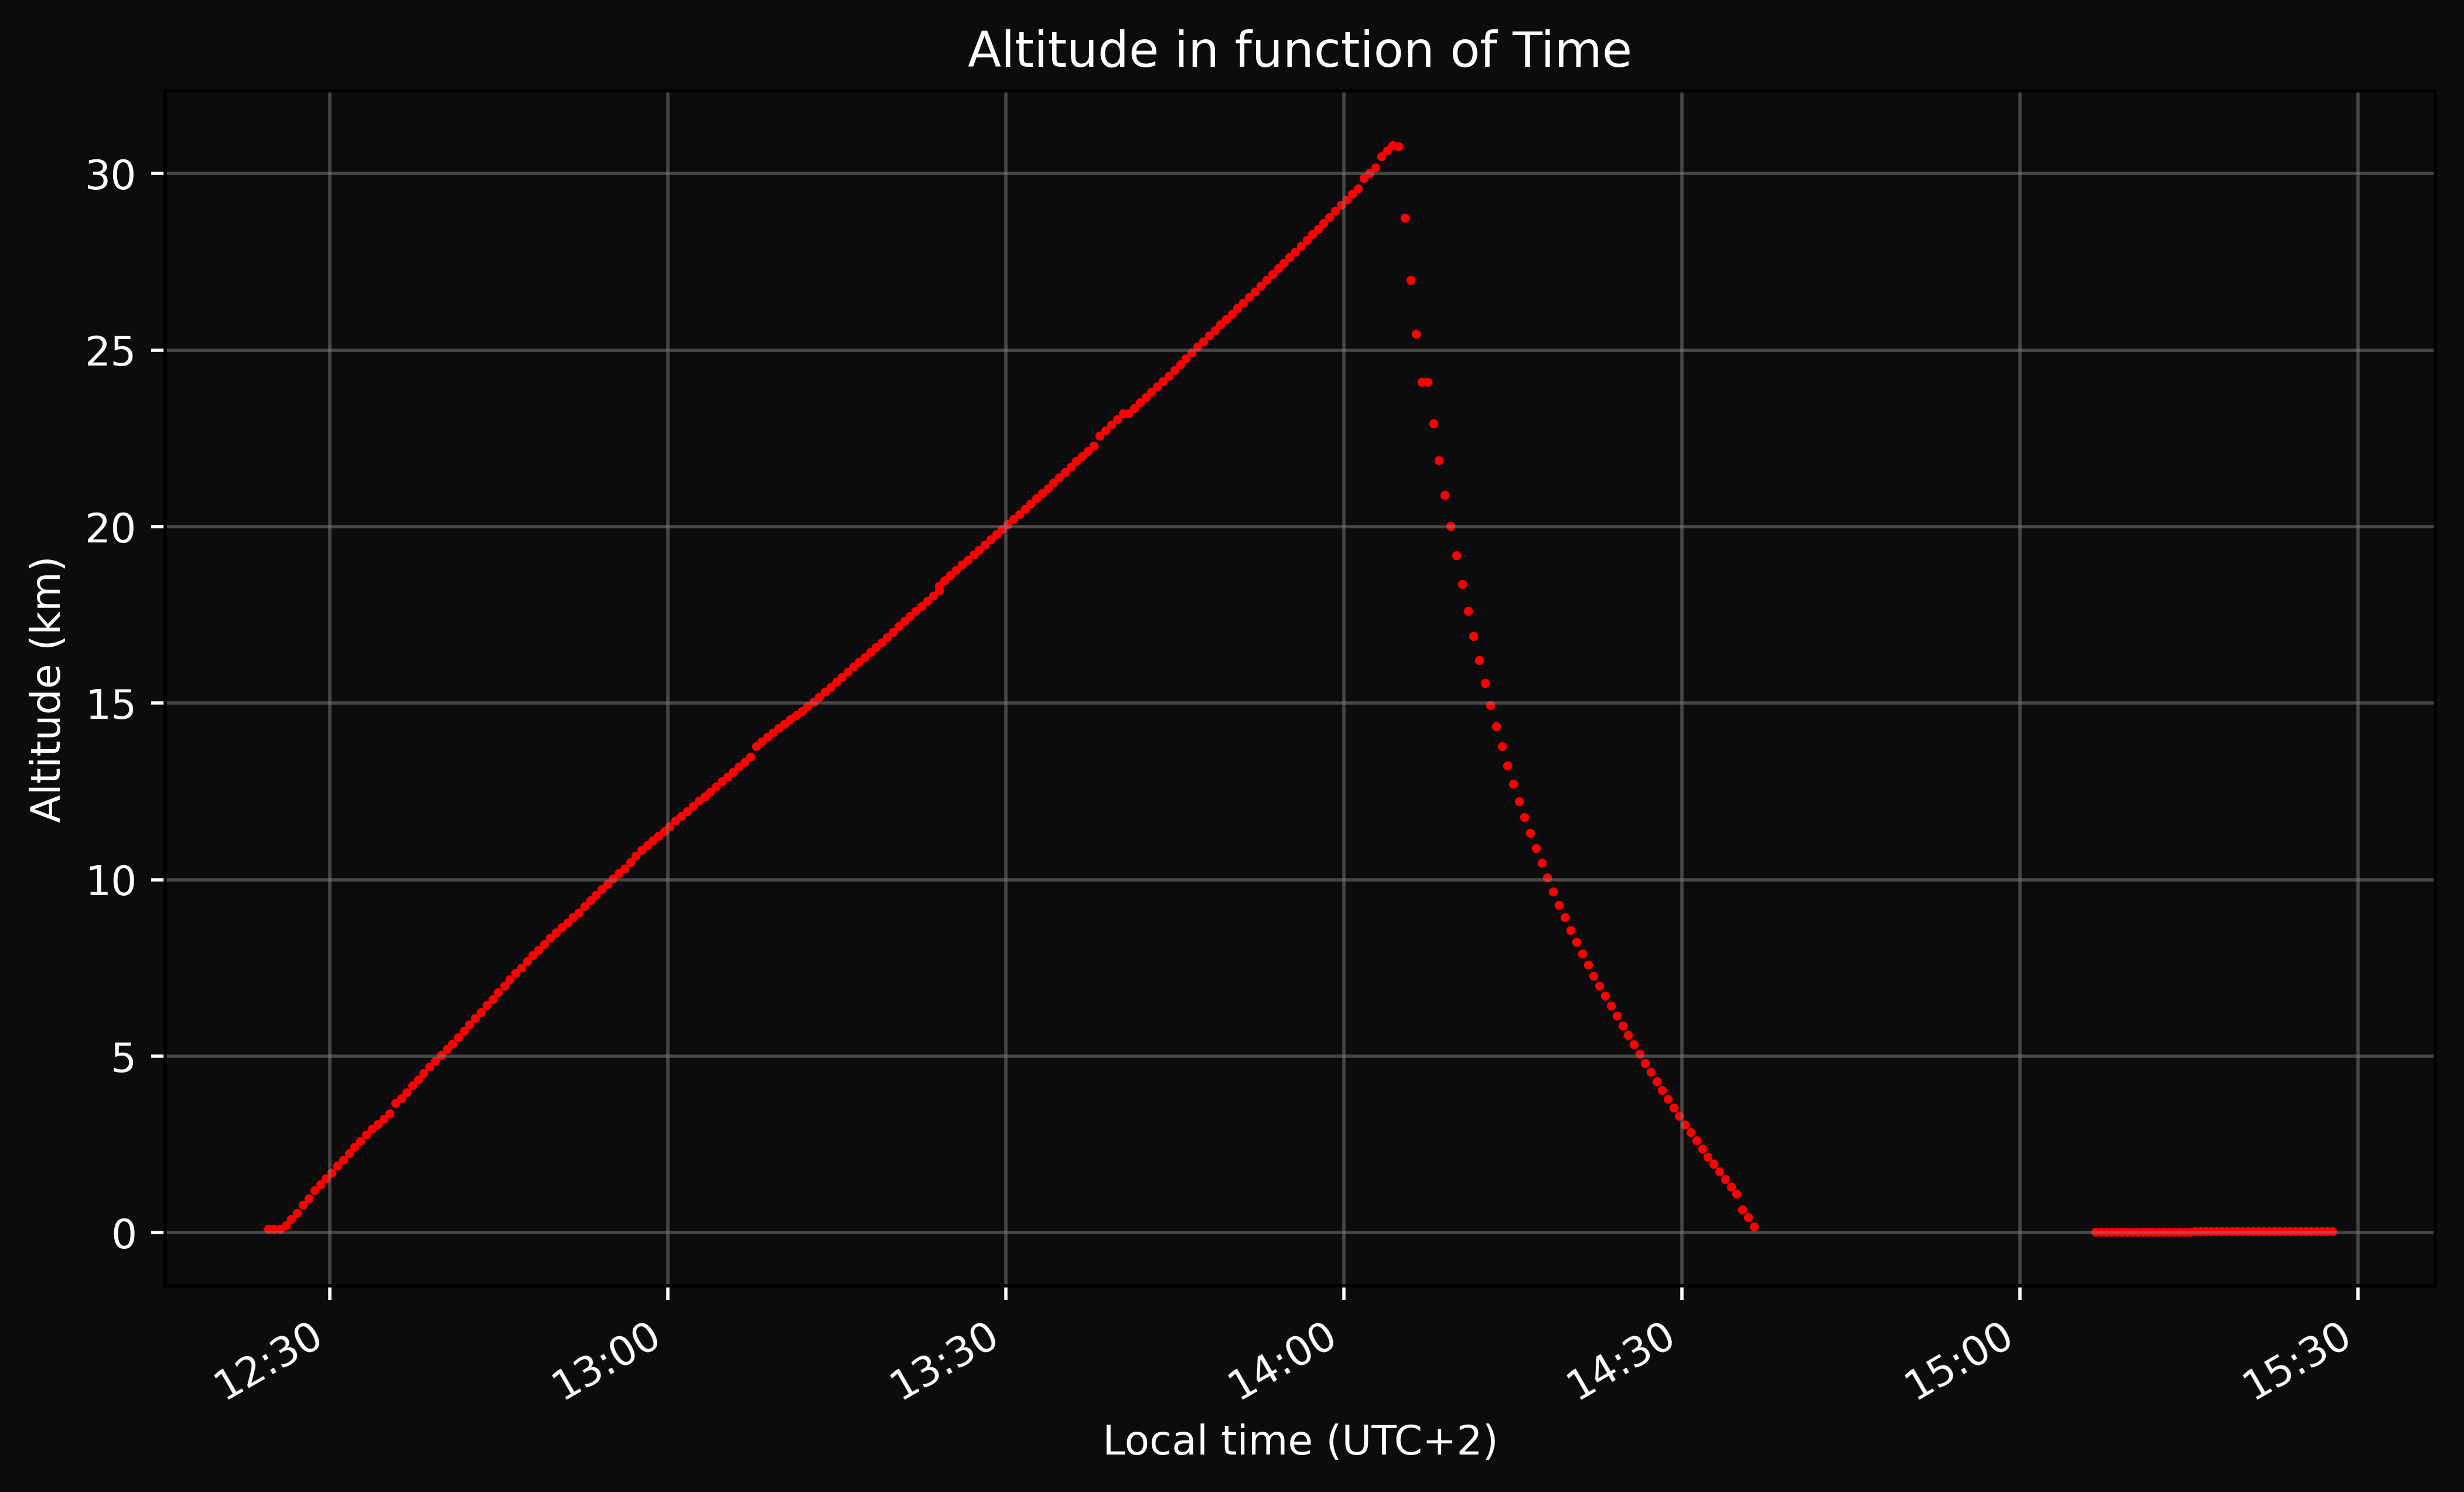
GPS Altitude vs Time
The altitude of the gondola steadily rises in function of flight duration until reaching a burst altitude of around $30.769 \,\mathrm{km}$ after flying for 1h40m, thereafter quickly descending until it gets slowed down by the parachute and made a safe splashdown in the water.
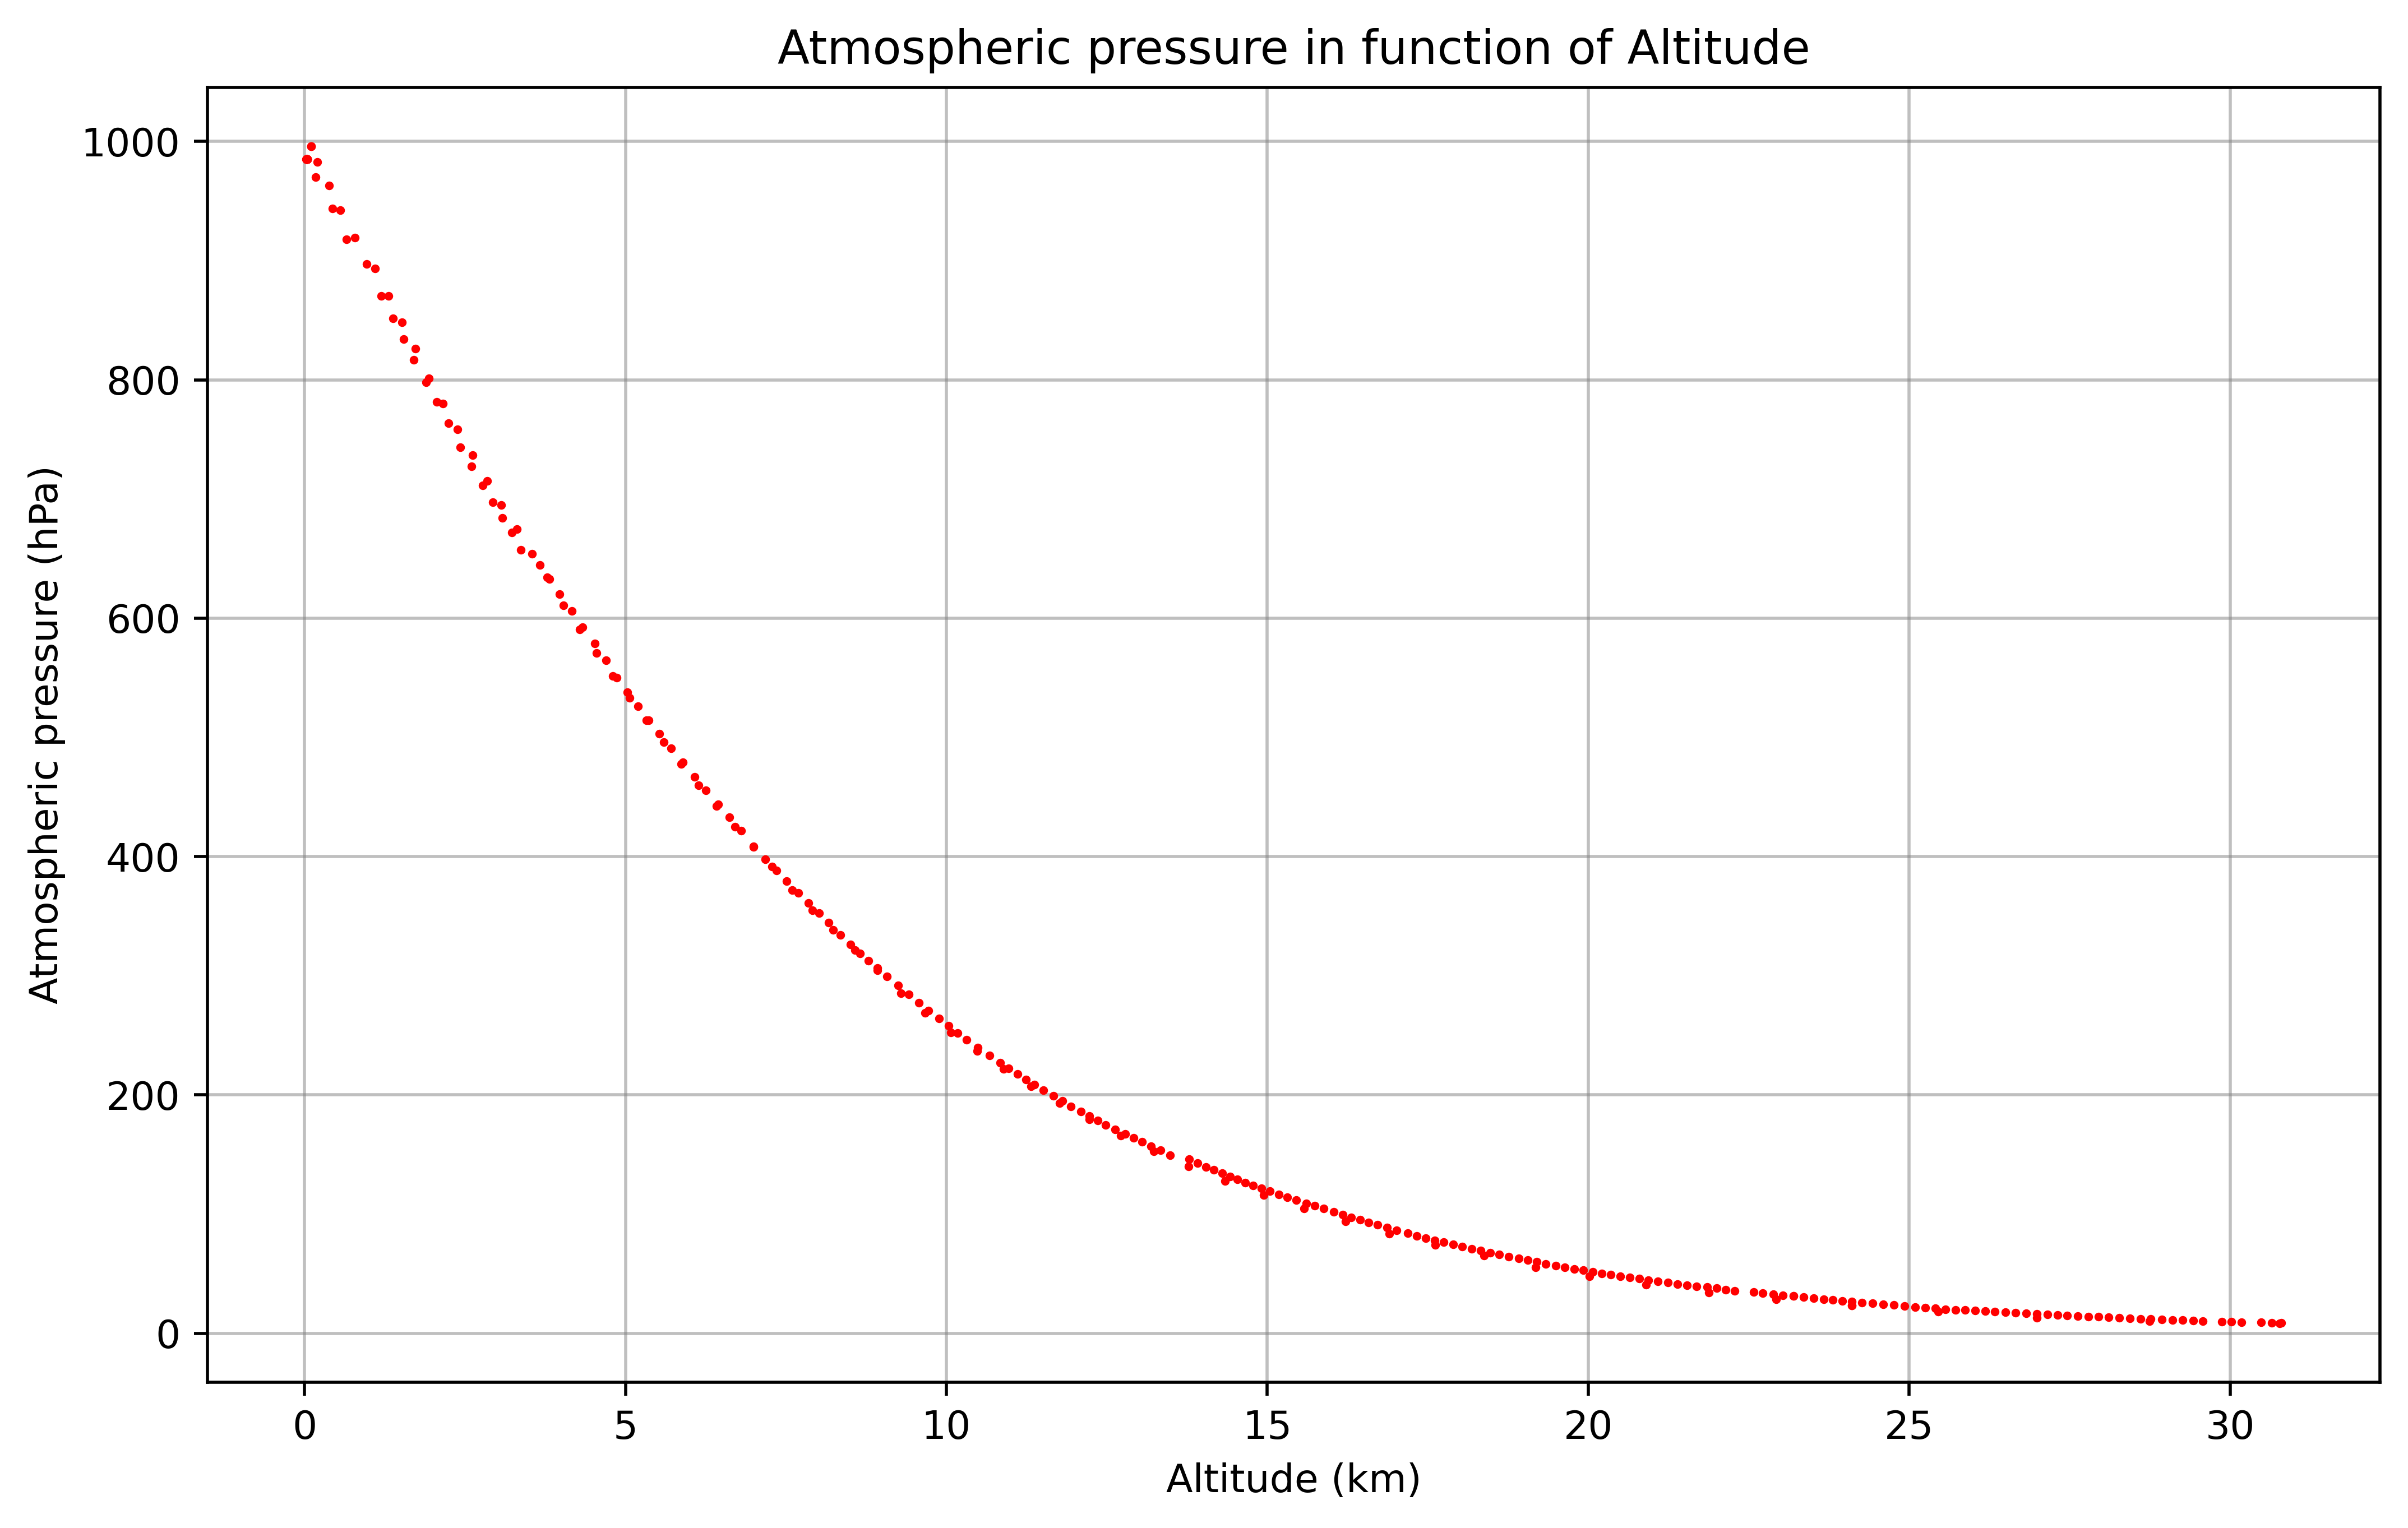
Pressure vs GPS Altitude
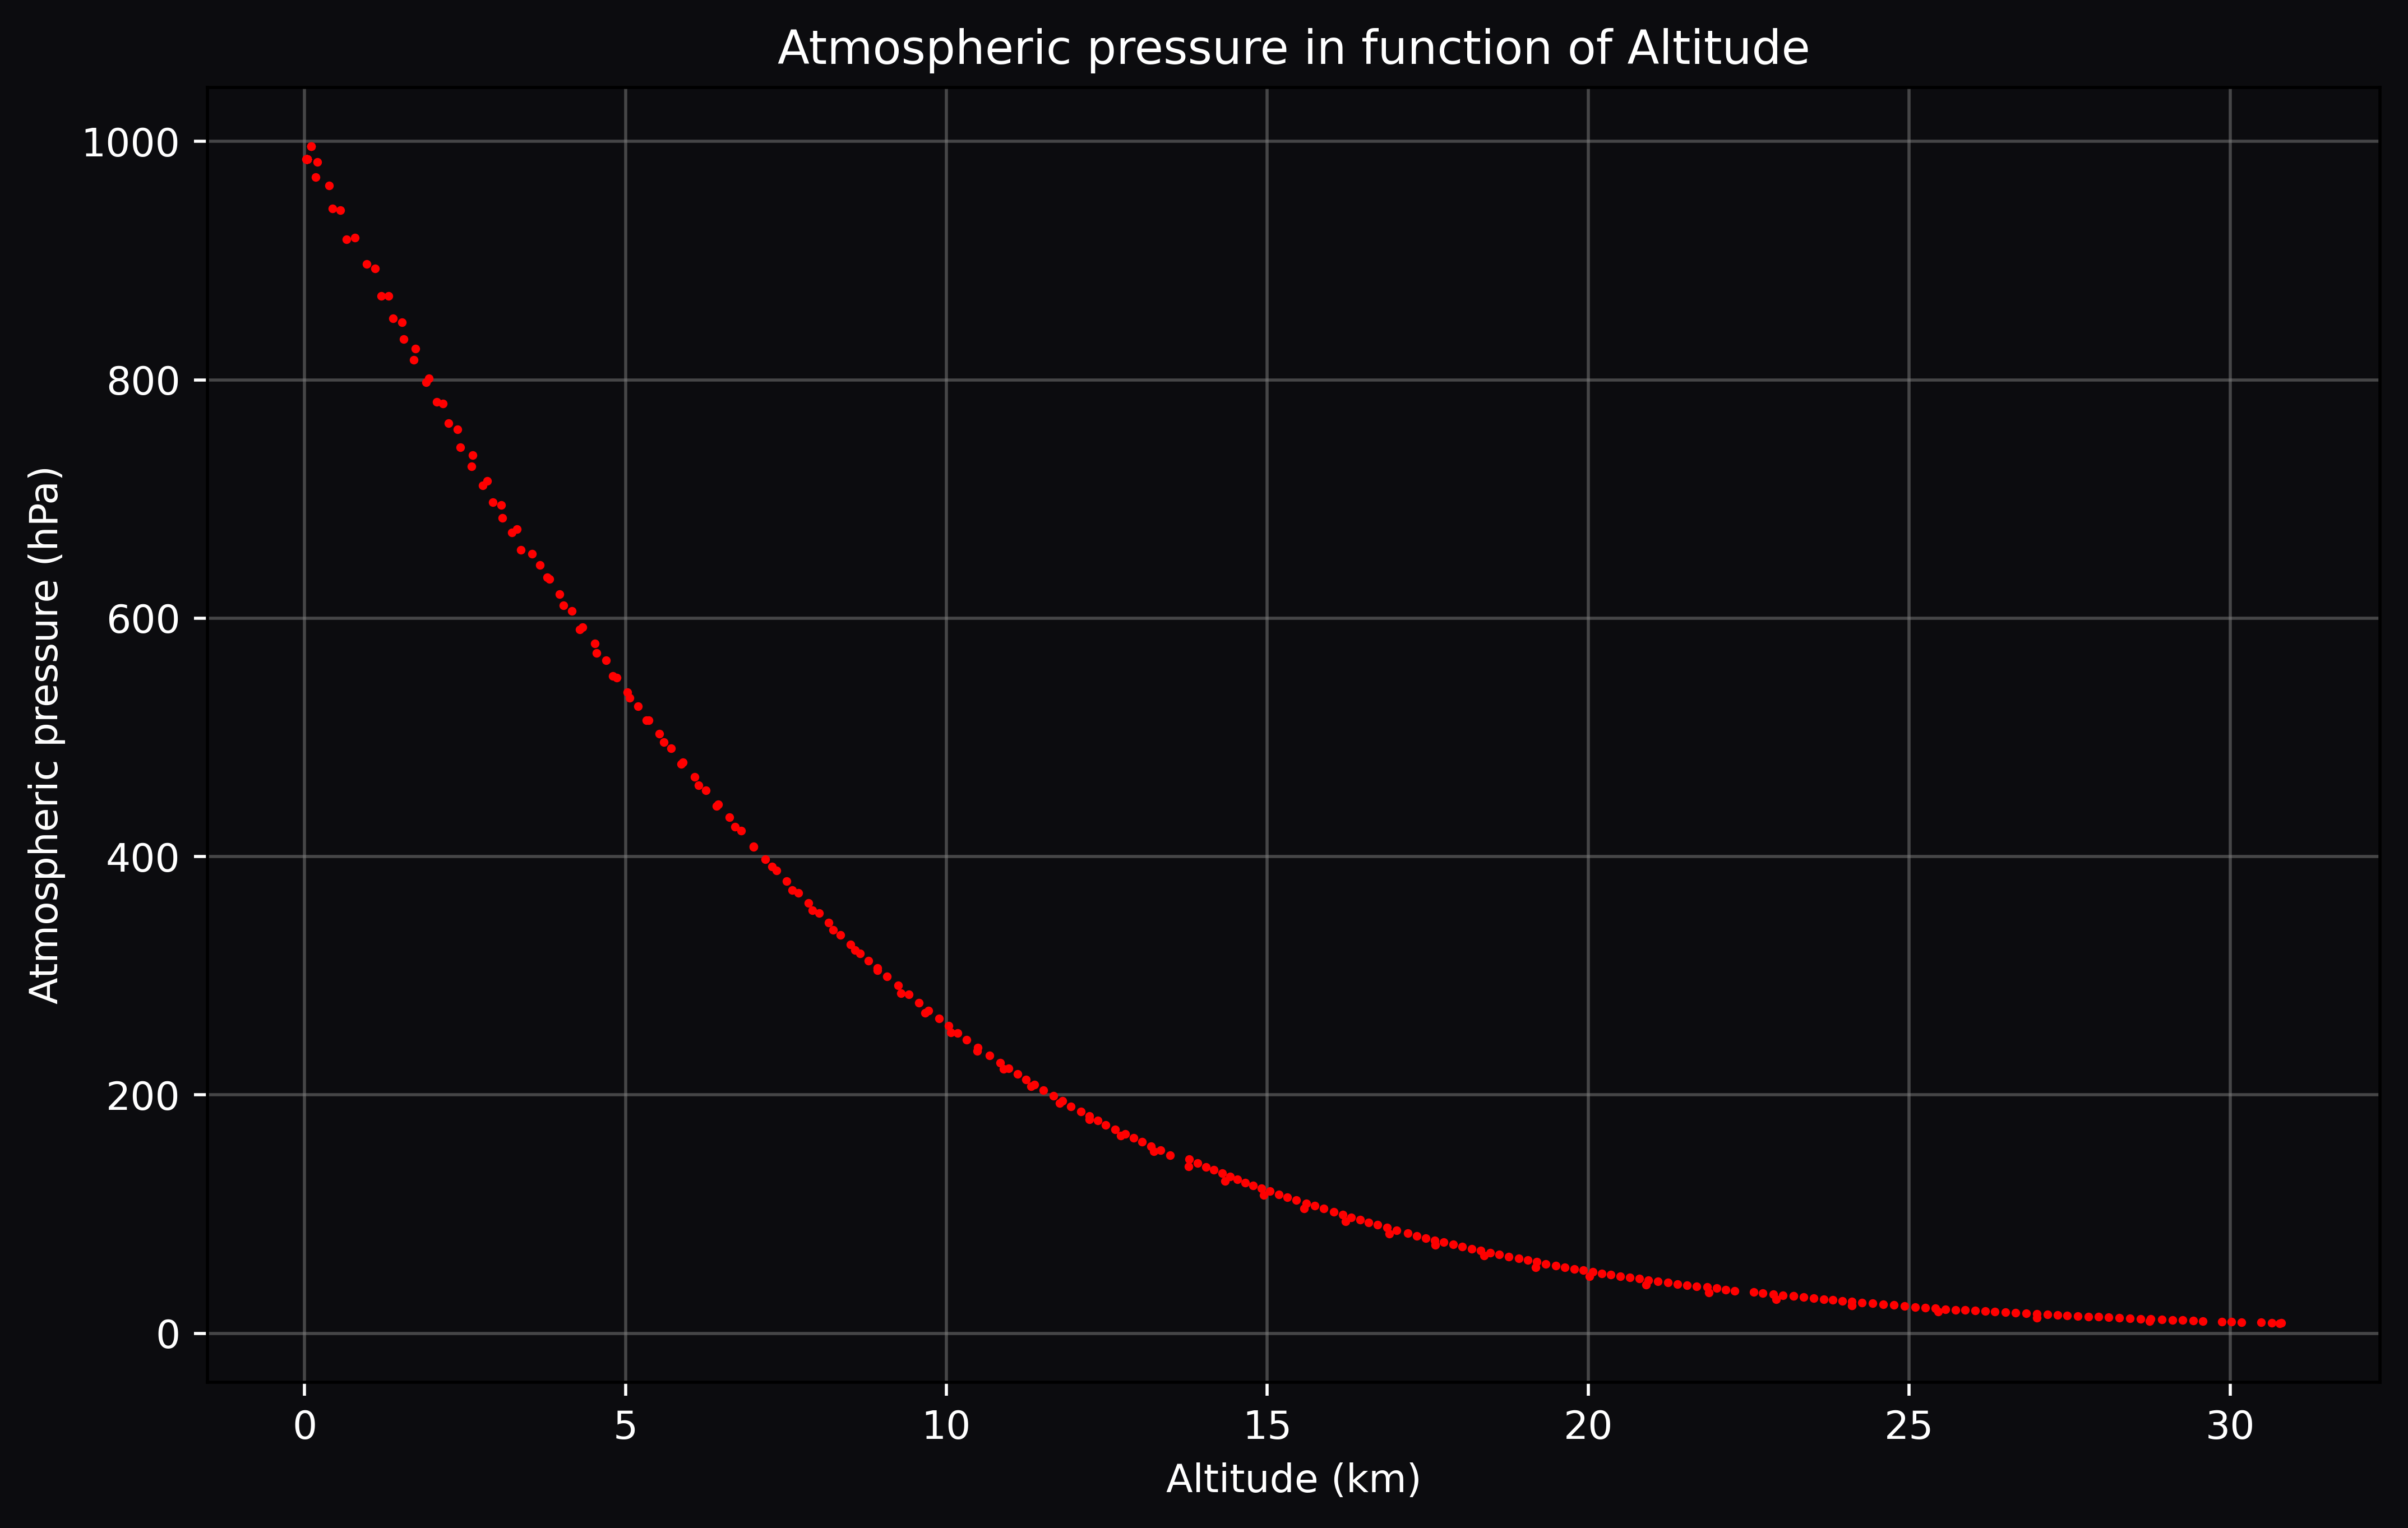
The atmospheric pressure decreases with increasing altitude as the weight of the overlying air column reduces. During the Asgard-XII flight, the gondola recorded a continuous drop in pressure from surface level to the stratosphere, reflecting the expected behavior of the atmosphere.
In the troposphere, where most weather occurs, the pressure approximately follows the barometric formula under the assumption of an isothermal layer:
\[P = P_0 \,\exp\left(\frac{-m\,g\,h}{k\,T}\right)\]With $P$ and $T$ as the atmospheric pressure and temperature at altitude, $P_0 = 996 \,\text{hPa}\,$ as the sea-level pressure on 23/03/2023, $h_0 = 102 \,\text{m}$ as the launch site altitude, $g = 9.80665 \,\text{m/s}^2$ as gravitational acceleration, $M = 0.0289644 \,\text{kg/mol}$ as the molar mass of air, and $R = 8.31432 \,\text{J/(mol·K)}$ as the universal gas constant.
Flight path map
Using the aprs.fi platform, displaying live APRS packets on a map of the Earth, the trajectory 2D of the gondola can be reconstructed. The plot clearly shows its easternly path and eventual landing site at Neuss, capturing the full journey of the flight from launch to recovery.
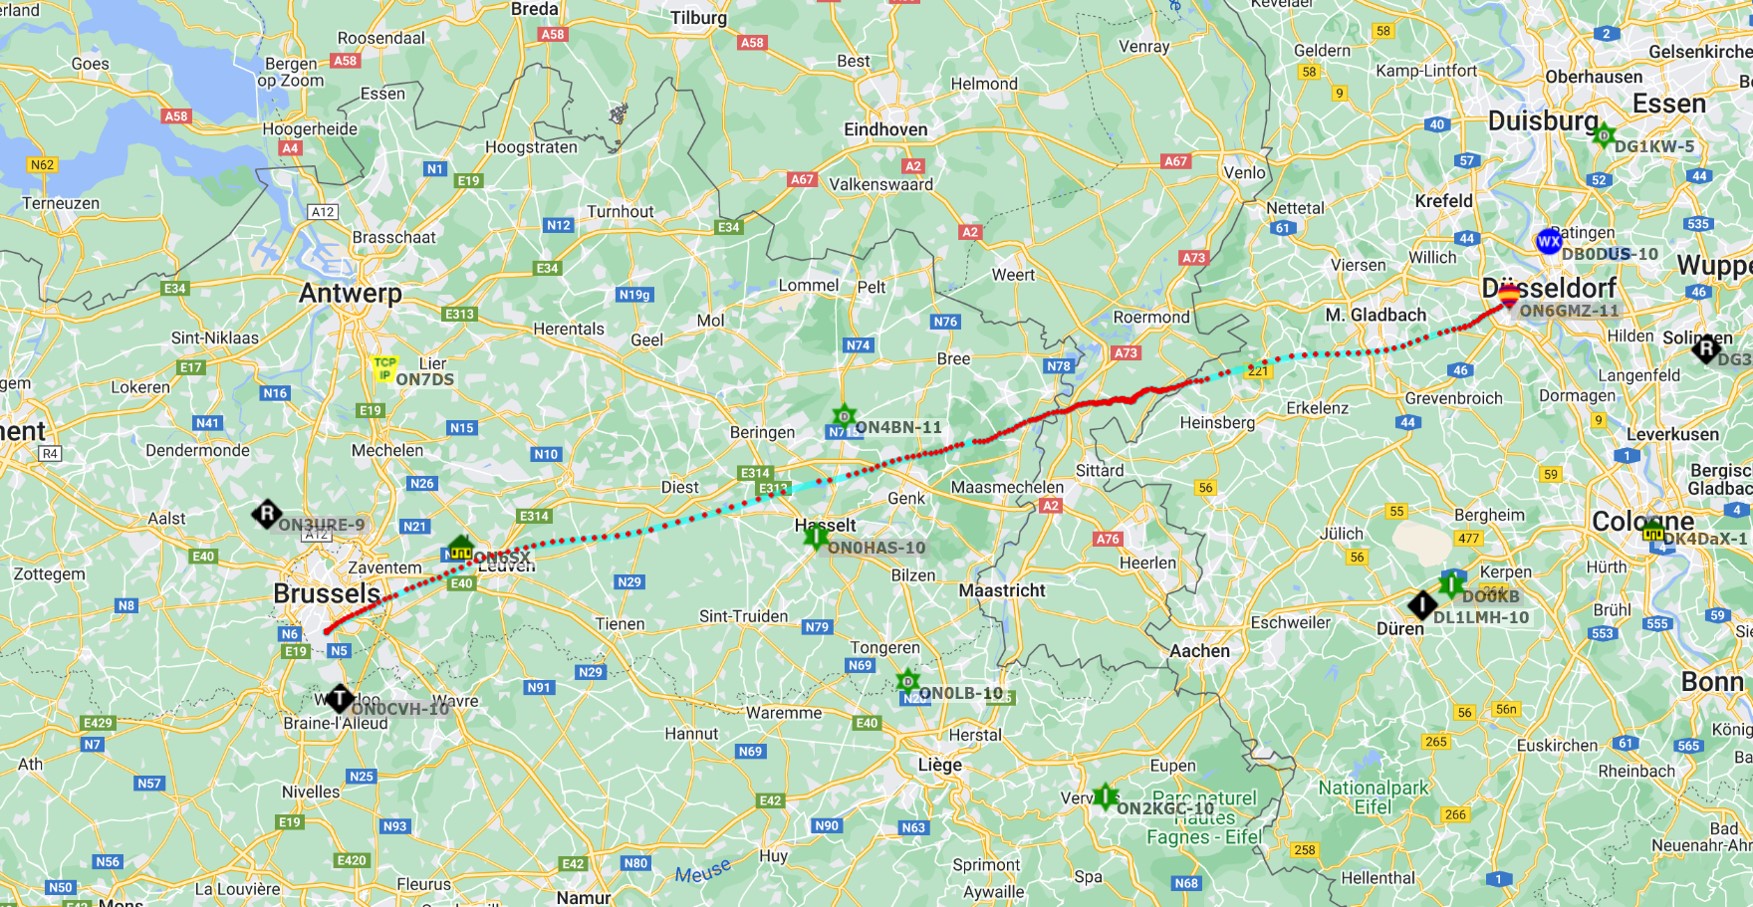 Asgard XII’s (gondola B) 2D flightpath on aprs.fi.
Using the received APRS packets, the gondola’s positional and altitude data were processed to generate a 3D visualization of its flight path within Google Earth, providing a clear view of its full ascent and descent profile.
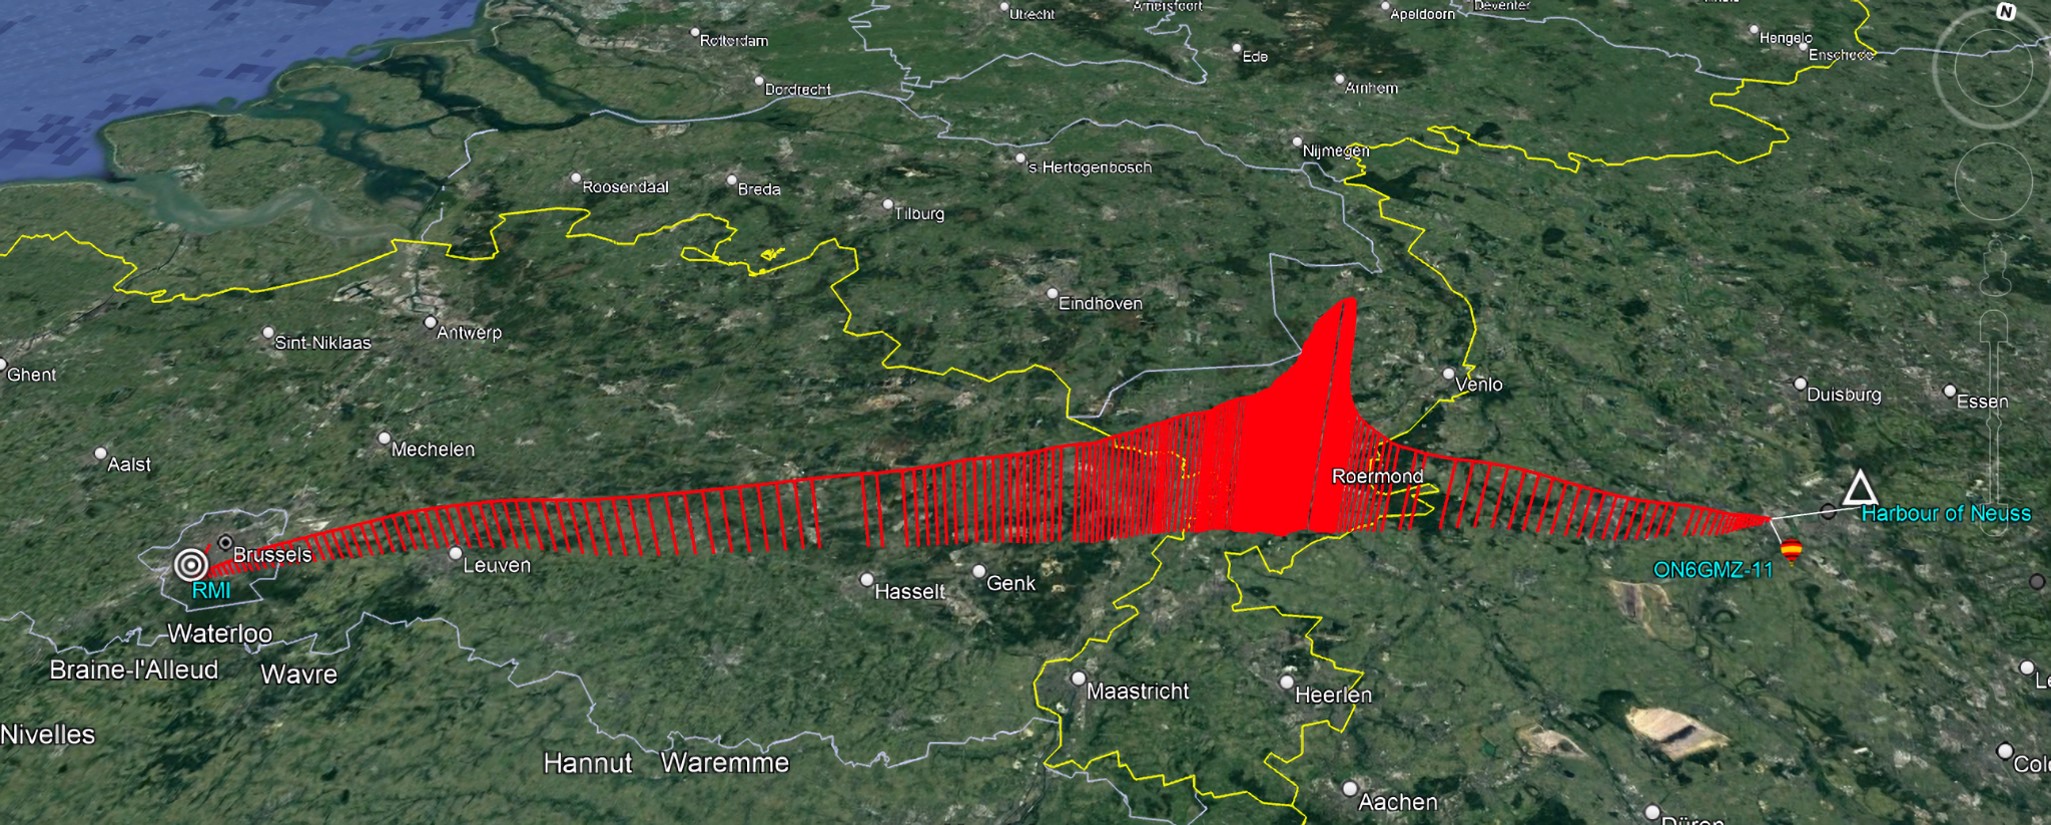 Asgard XII’s (gondola B) 3D flightpath displayed in Google Earth.
Edit: Original graphs have been improved in resolution and clarity.
Recovery
As there were strong winds at ground level and the weather forecast predicting even stronger wind currents at higher altitudes, we anticipated that the balloon would travel a significant distance. The balloon lifted off successfully, carrying our experiment into the stratosphere, and almost immediately we began receiving APRS signals with accurate GPS and sensor data. Strong westerly winds quickly pushed it toward Germany, so we followed its path, tracking the coordinates for over two hours and 200 km.
As we saw the altitude of the balloon decrease rapidly and moving towards a canal in the industrial harbor of Neuss, Germany, our anticipation quickly rose. Eventually we saw that the last telemetry packet was measured directly above the center of the canal, upon arriving at the location we hypothesized that the gondola must have landed in the water. With guidance from a helpful dockworker, we located it on the water’s edge and, after a short struggle, retrieved the gondola along with our experiment. Later that evening, around 20:00, we returned to the Meininger Hotel in Brussels, unboxed the gondolas, and began distributing the other student’s experiments. After this we started to analyze our own data for the final presentation while celebrating the success of our adventure.
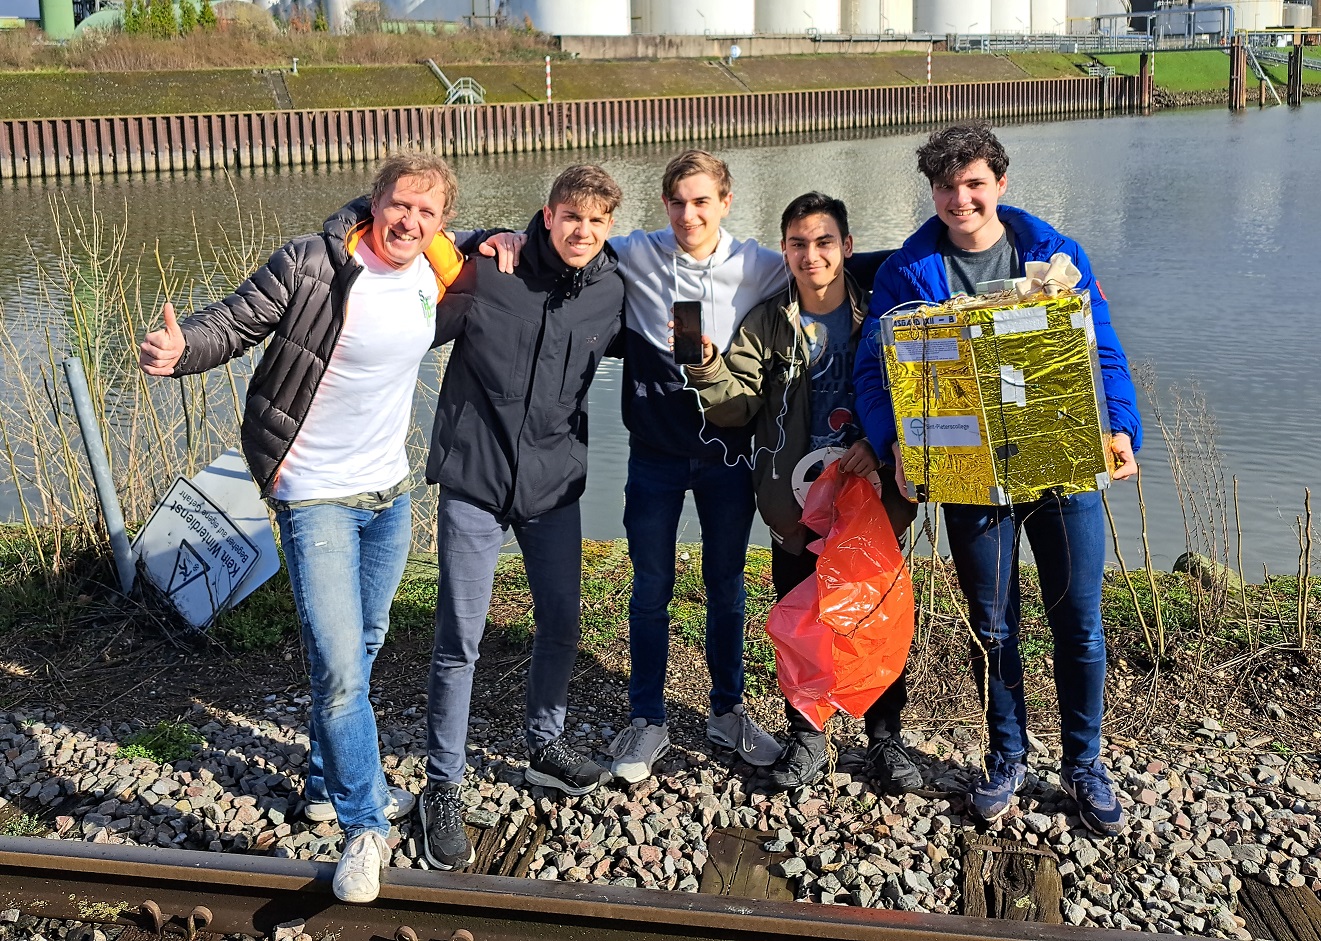 Recovery of Asgard-XII gondola in industrial harbor of Neuss, Germany.
Many thanks to the Royal Meteorological Observatory and Erik de Schrijver (Asgard campaign management) organizing this extraordinary experience for high school students as well as my amazing teammates Antonius Dinca, Siebe Penders, Seppe Odeur who went along for the adventure and assisted in team.
If you want access to the raw data (GPS, sensor, etc.), don’t be afraid to reach out!