Asgard-XI
A student-built stratospheric payload improving the Habduino tracking code with APRS telemetry, launched during the Asgard-XI campaign.
The ASGARD project gives high school students the chance to plan, build, and launch real scientific experiments into near space using high-altitude balloons, combining teamwork with hands-on learning. For an overview of all launches, see the ASGARD project post.
Project
As the senior students by now have graduated, I took on the lead of the Asgard XI project being assisted by classmates Thomas Sondakh and Giel Swenters. This second edition focussed on improving the code of the Habduino tracking module to make the code run more efficient.
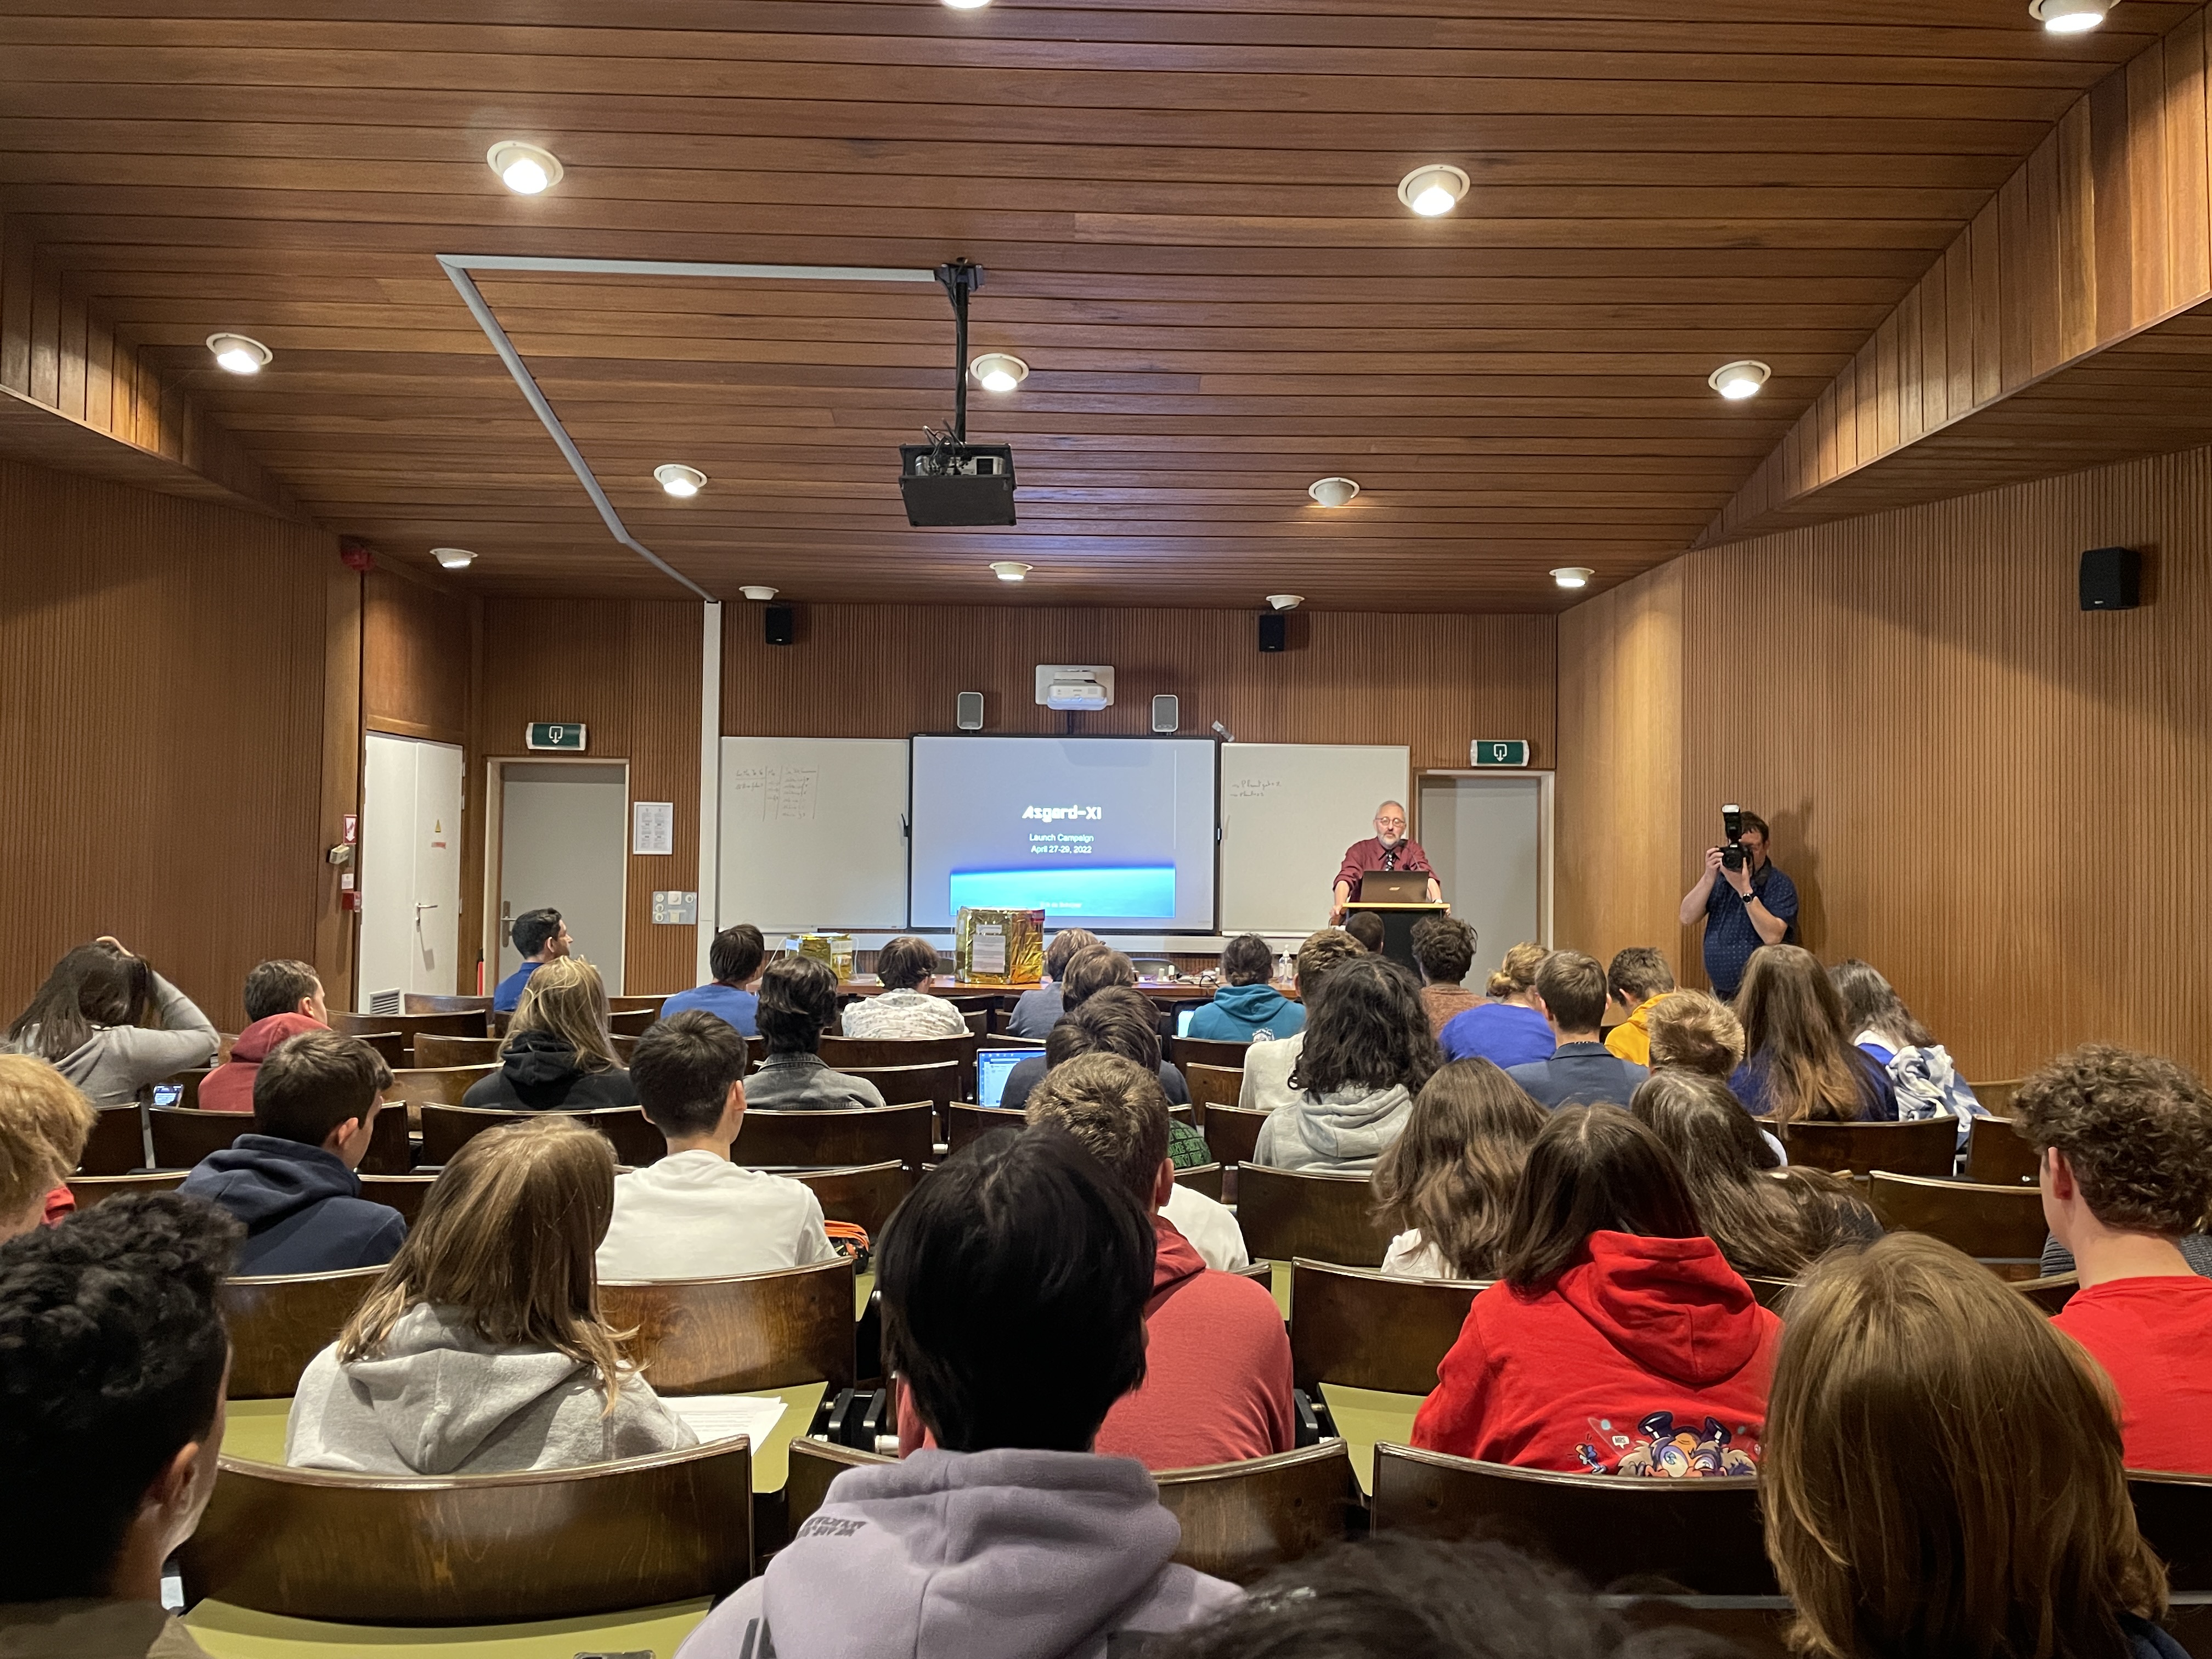 Asgard XI presentation
At the Brussels Planetarium we presented our project to the fellow international student teams as well as watching an interesting dome movie about the formation of the Earth. Afterwards we went outside to make a group picture in front of the Planetarium.
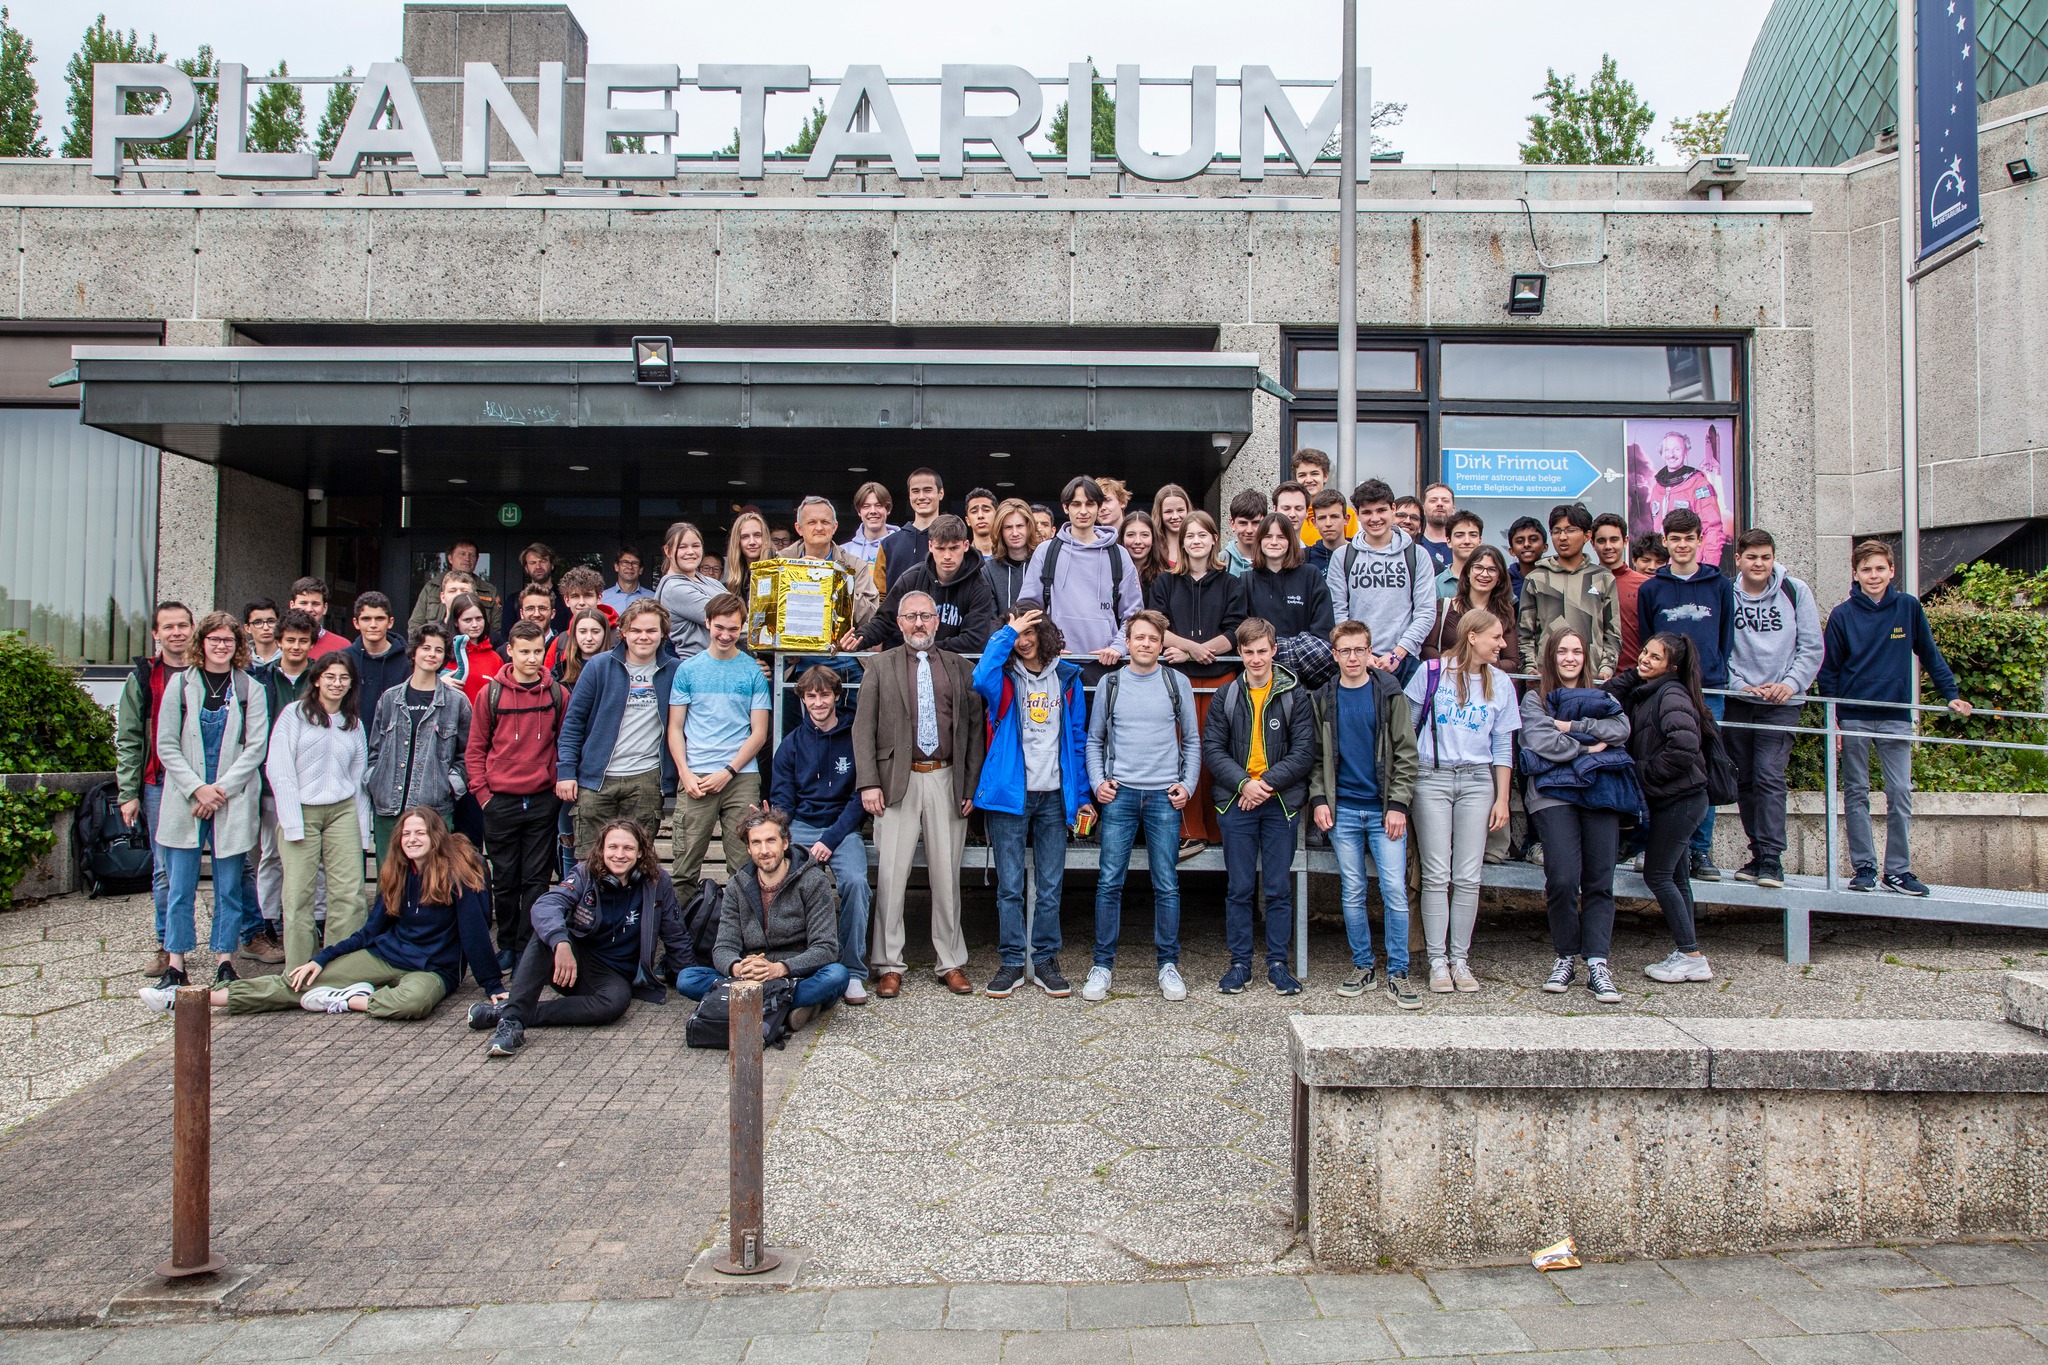 Group picture of all the students involved in the Asgard XI campaign.
Launch
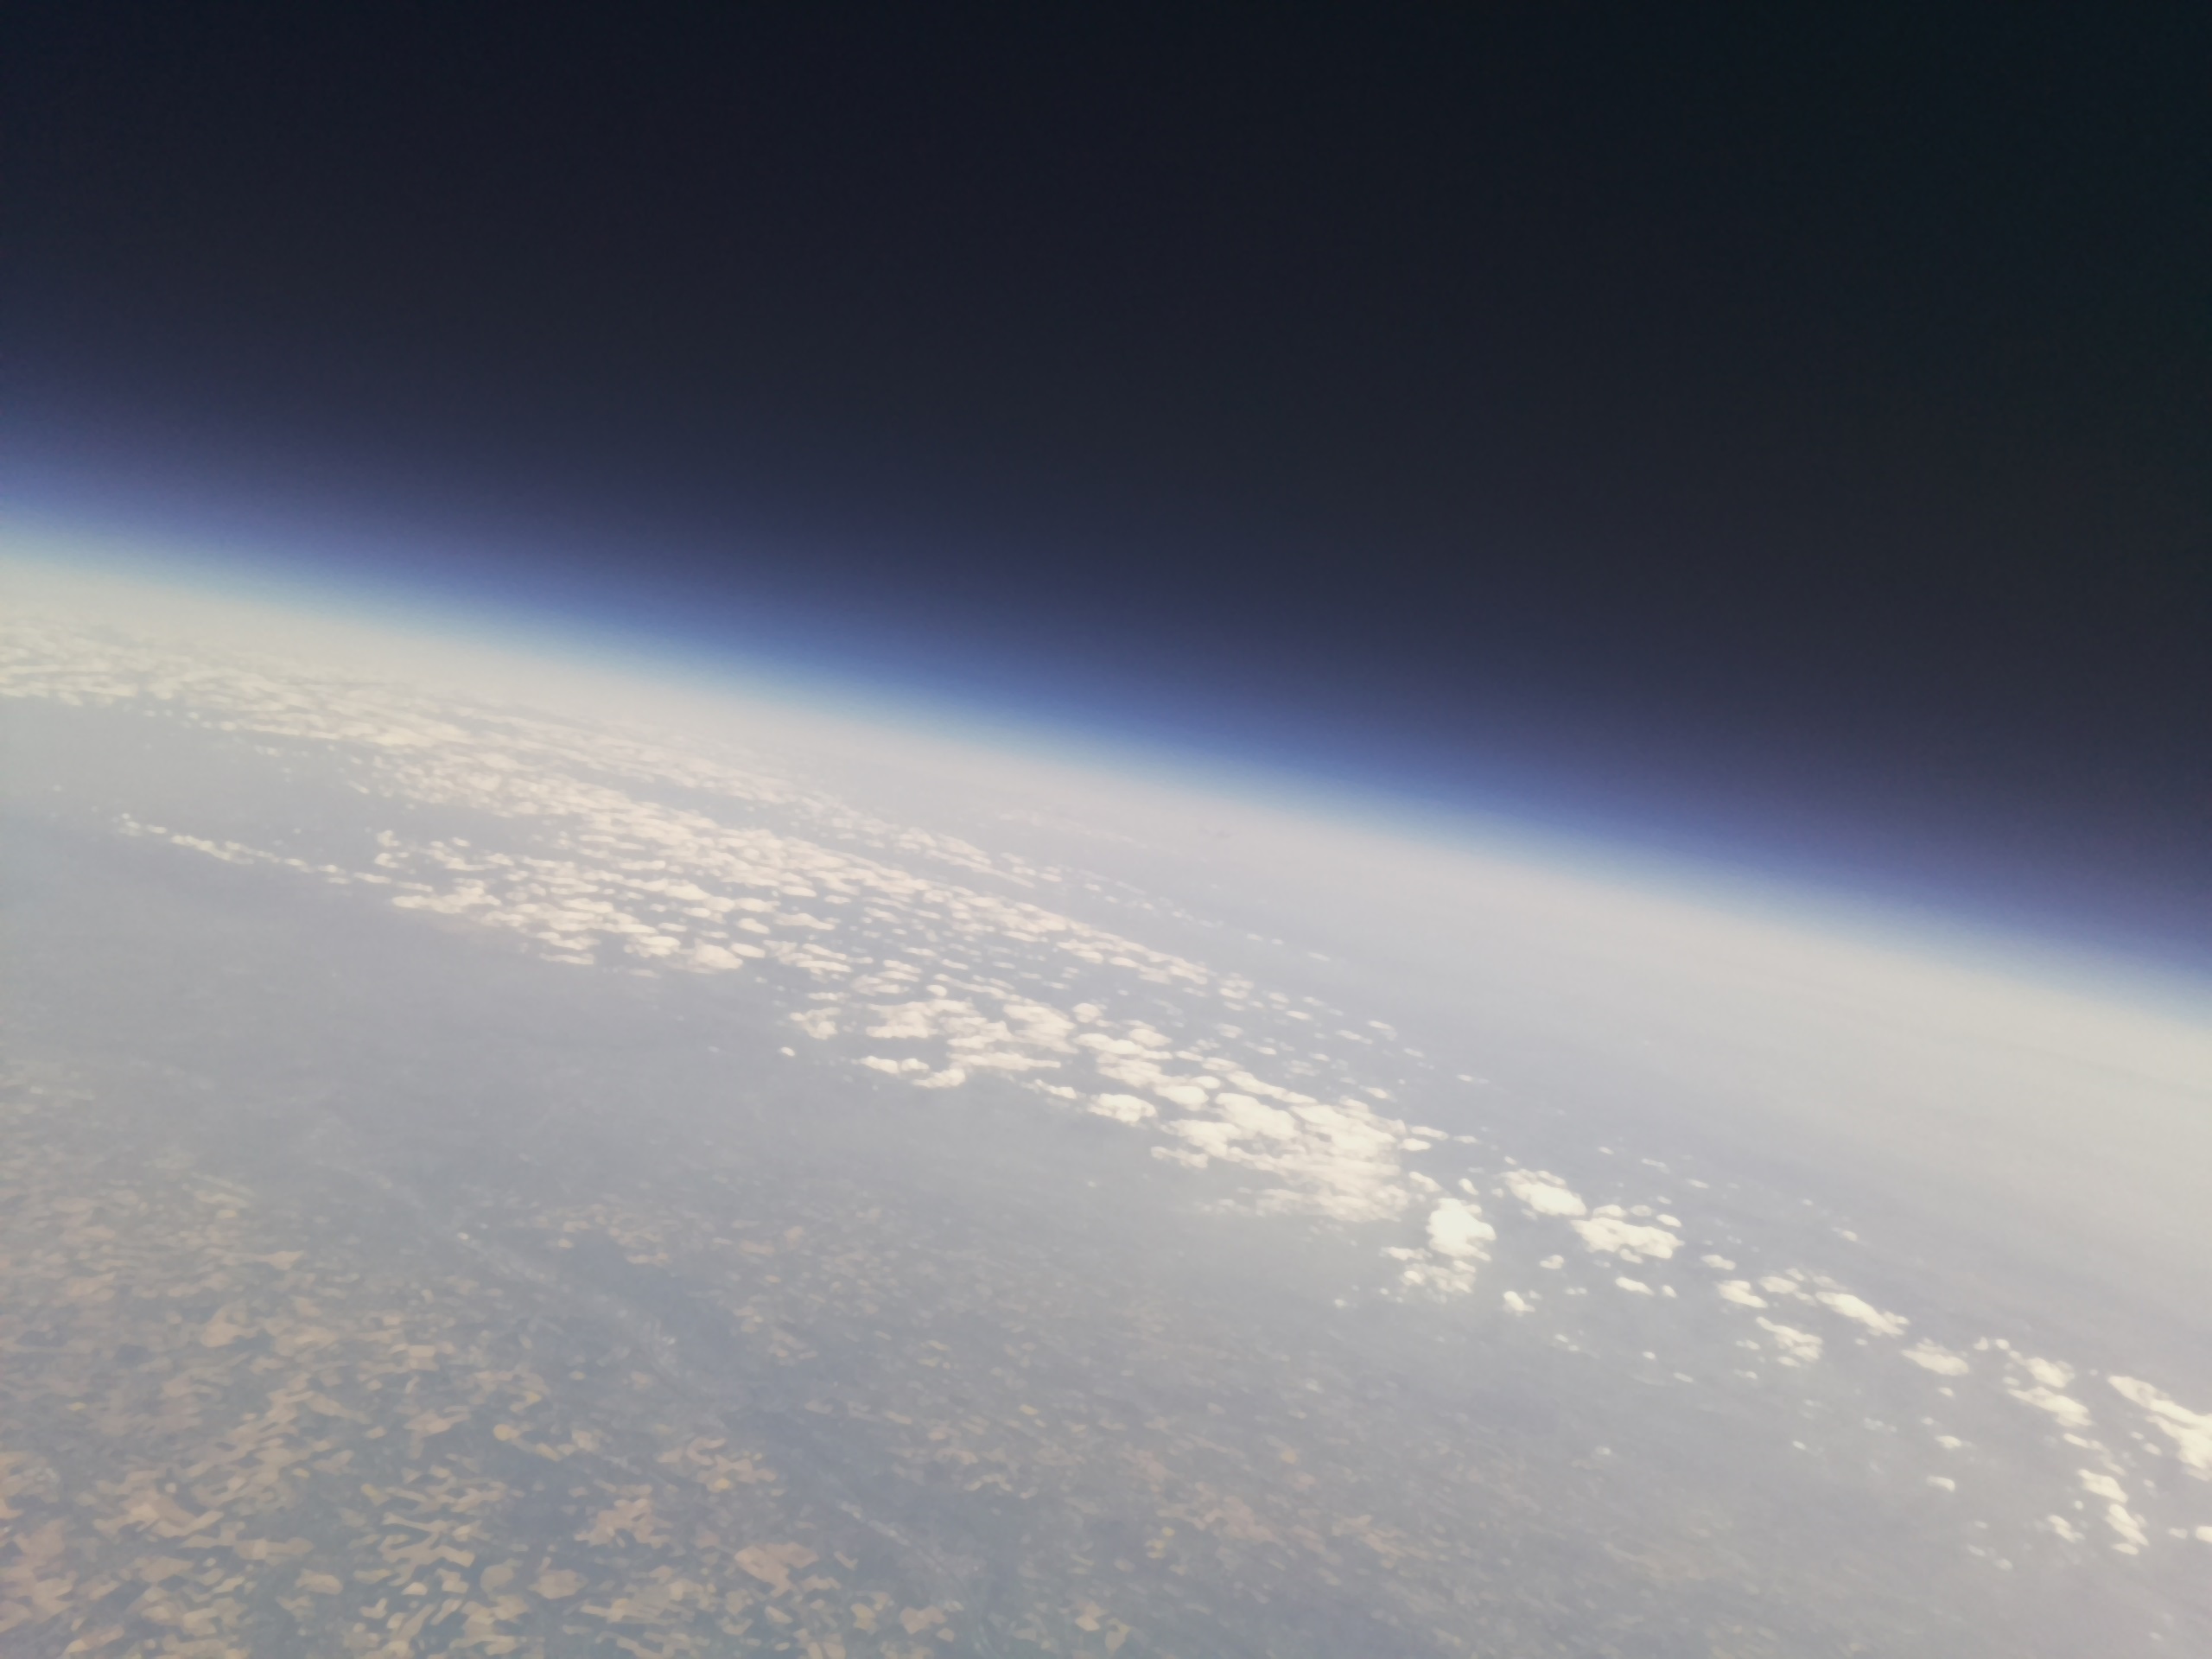
Lifting off at 12h25 (UTC+2) from the Royal Meteorological Institute in Uccle, Brussels. After release, the gondola quickly ascended into the clear blue sky. Drifting with the wind towards the south-east.
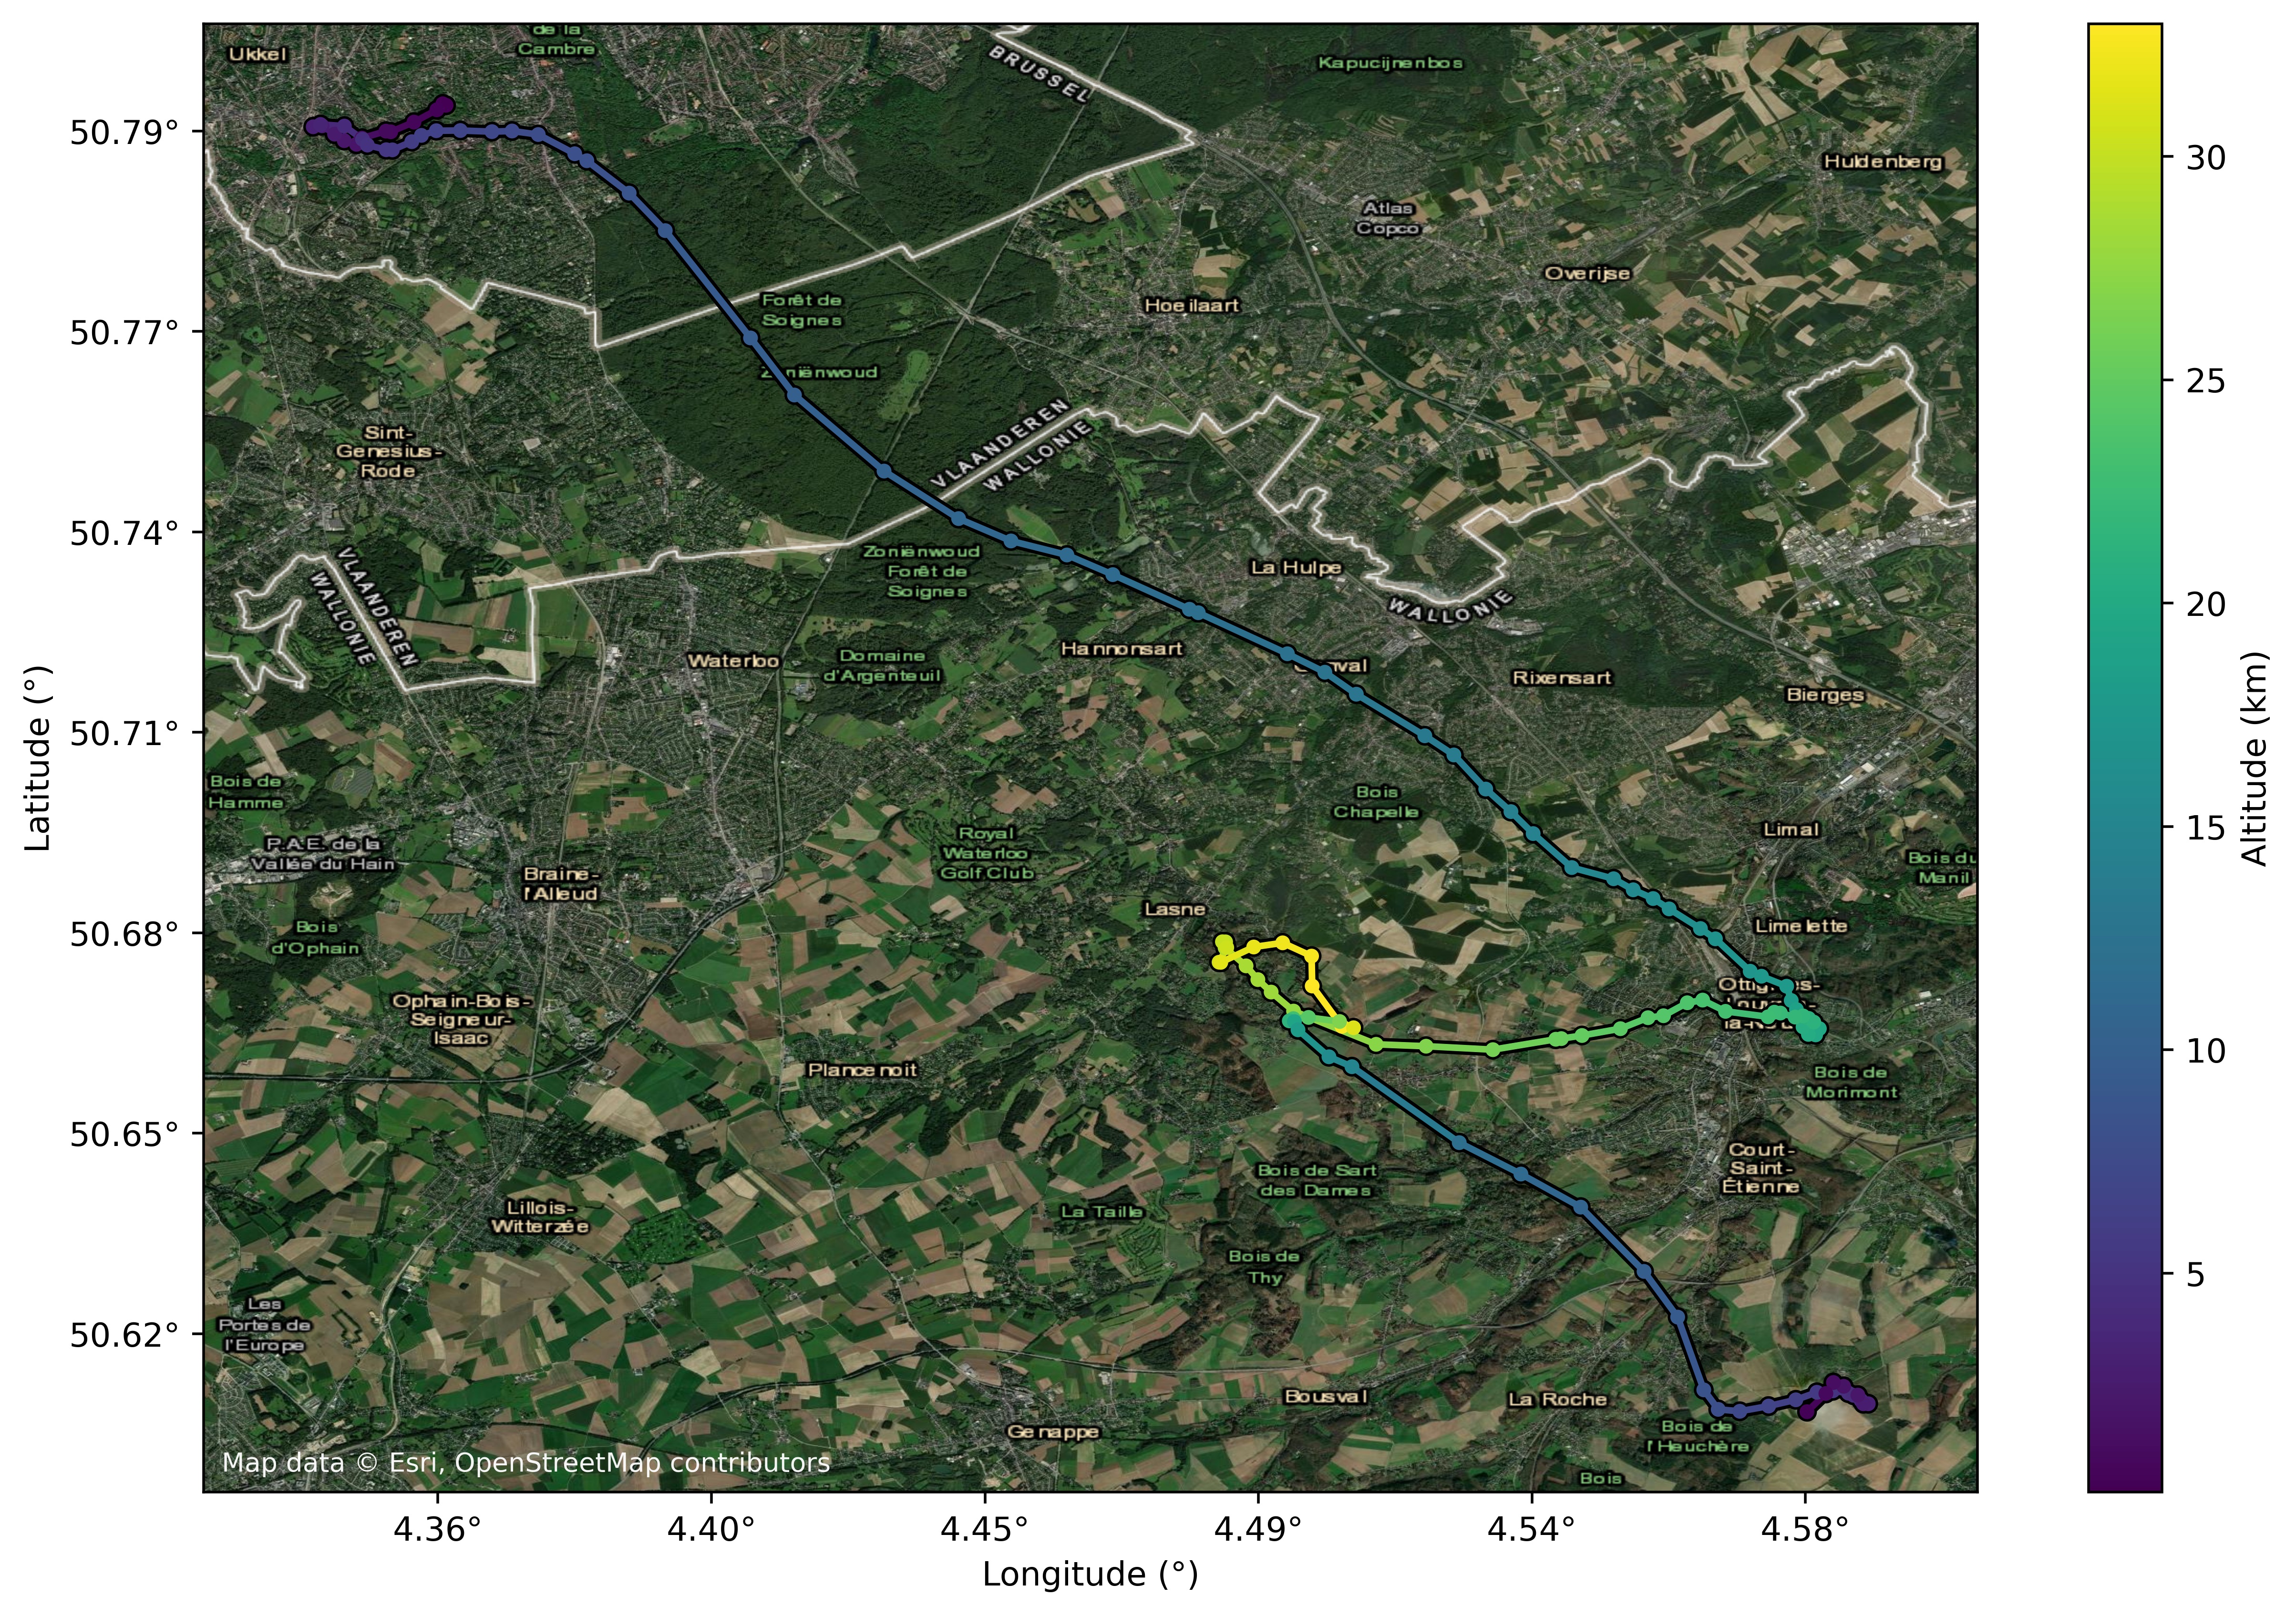
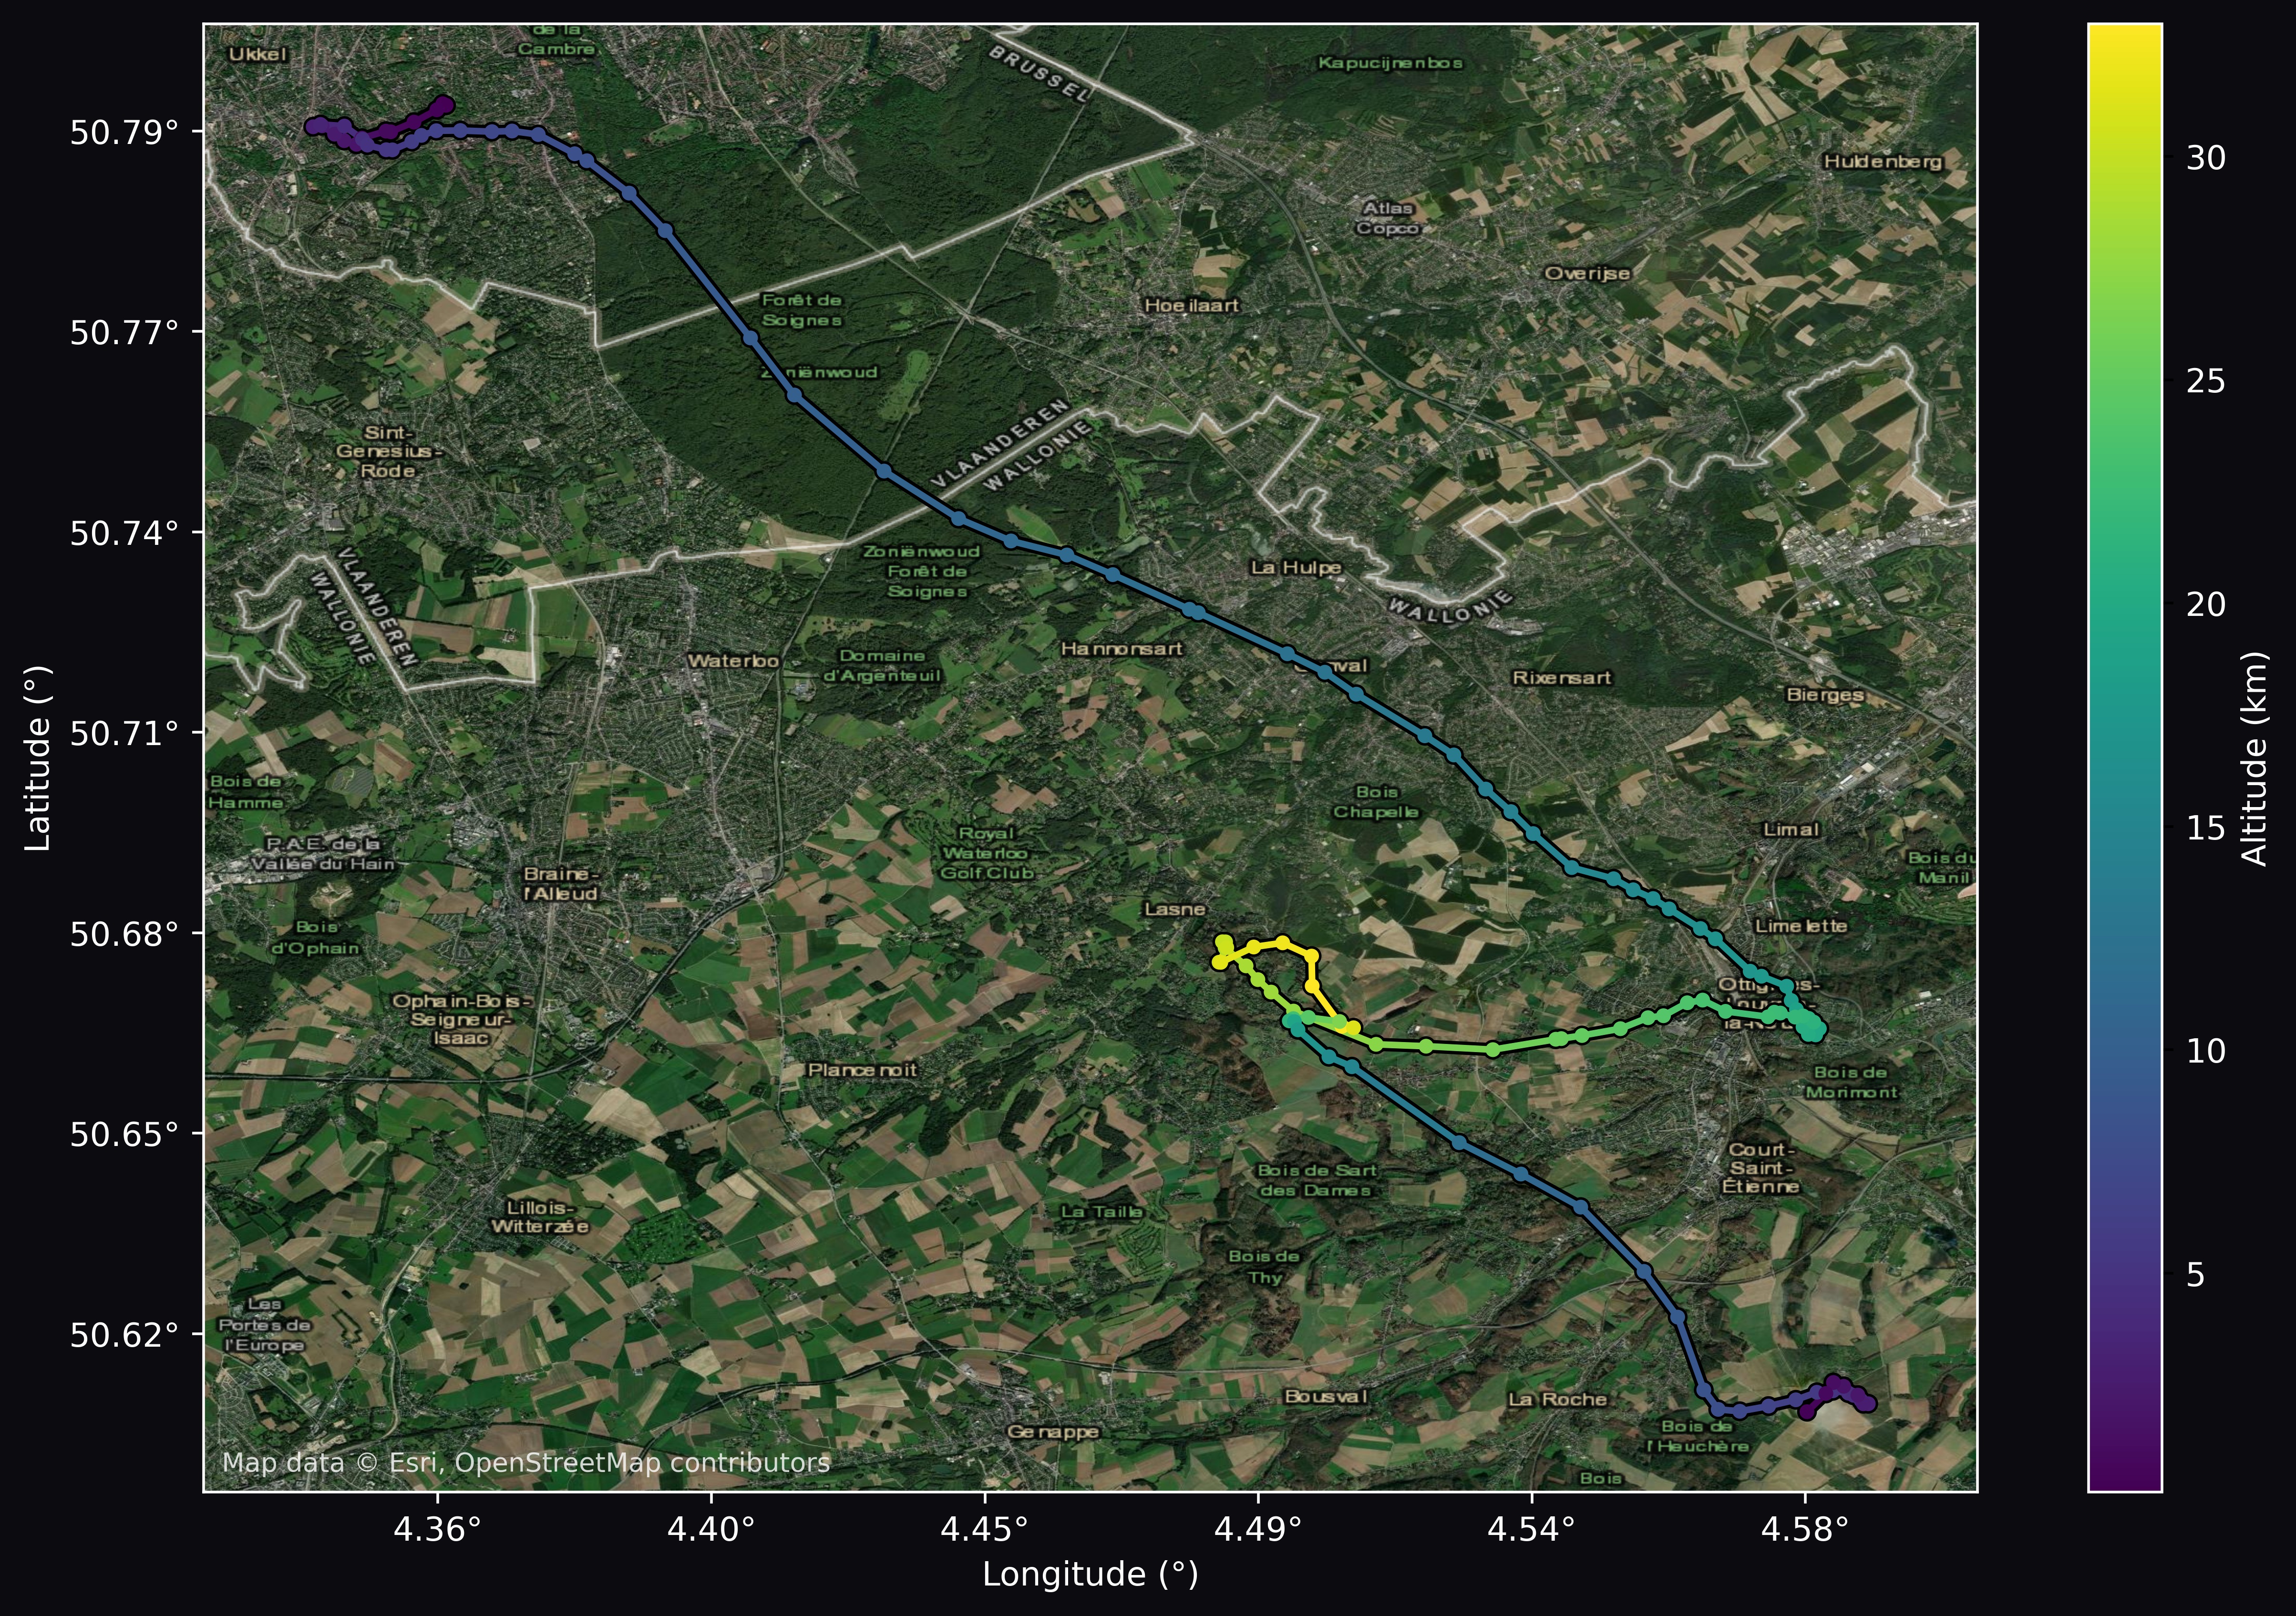
Flight path map
By analyzing the telemetry packets containing GPS coordinates and altitude, we reconstructed the 3D trajectory of the gondola. The plot clearly shows its southeasterly path, capturing the full journey of the flight from launch in Uccle to recovery in Court-Saint-Étienne.
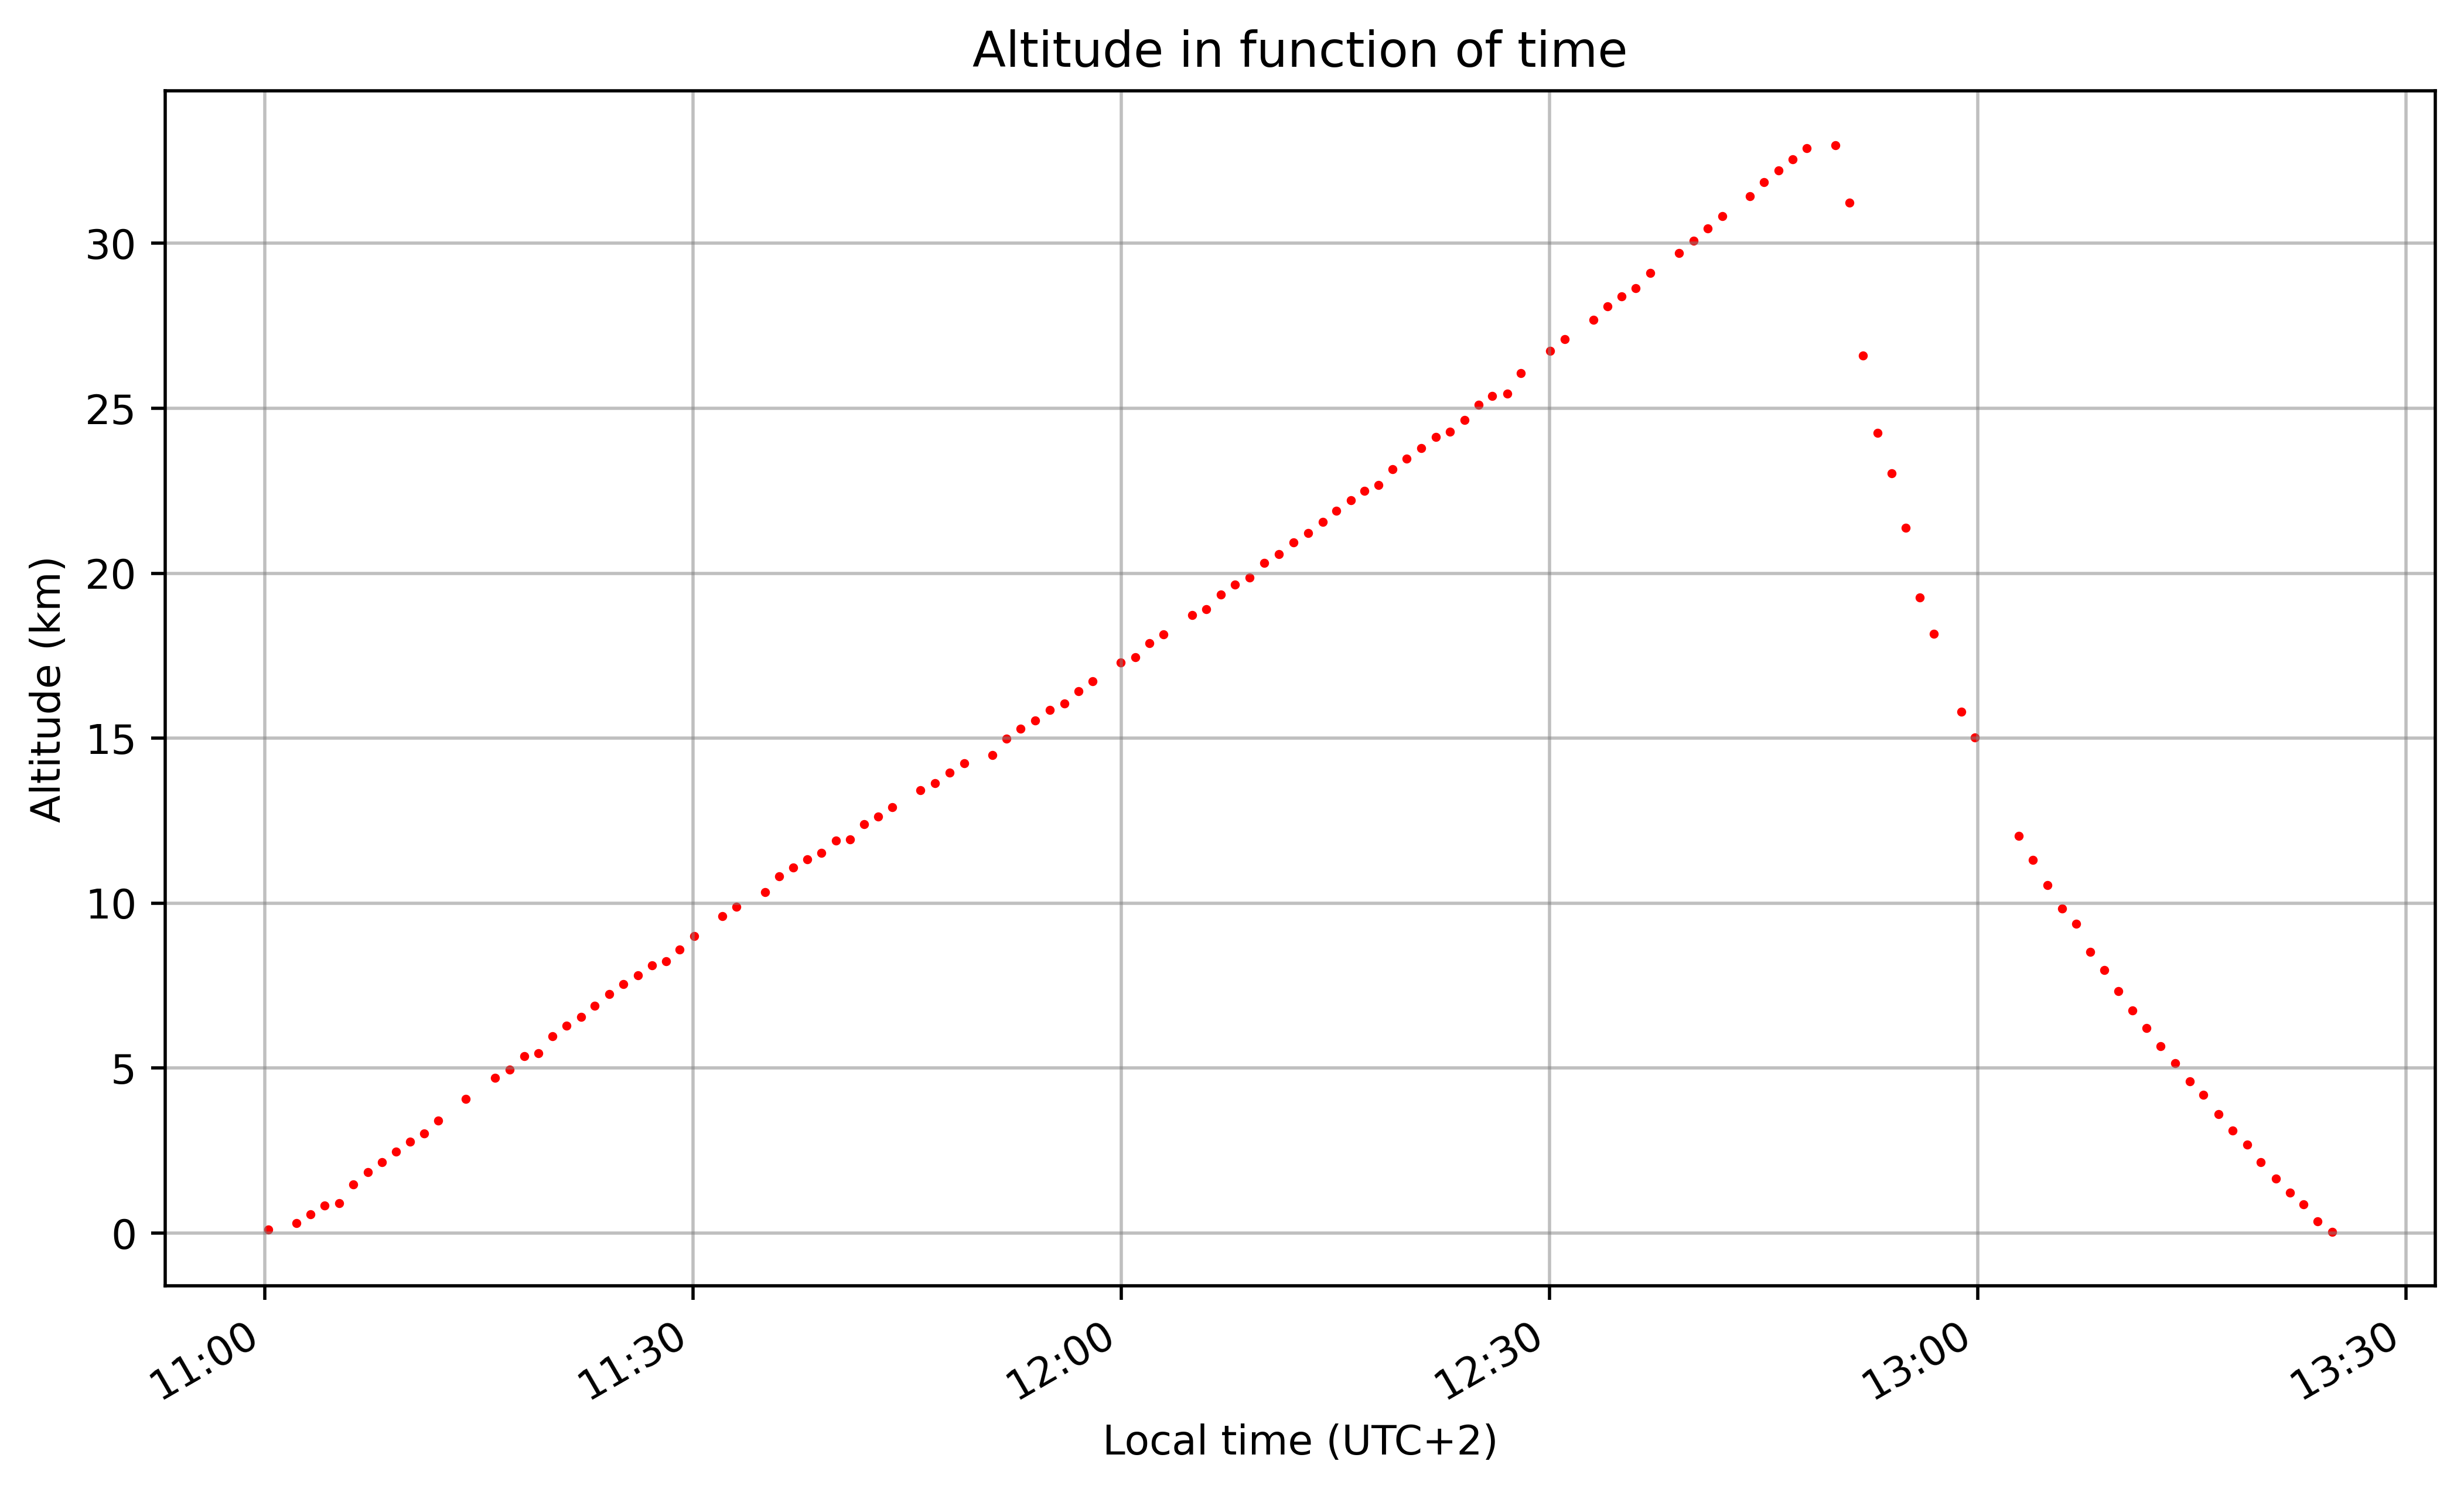
Altitude in time
The altitude (GPS) of the gondola steadily rises in function of flight duration until reaching a burst altitude of around $32.97 \,\mathrm{km}$ after flying for 1h50m, afterwards descending and making a safe landing on the ground.
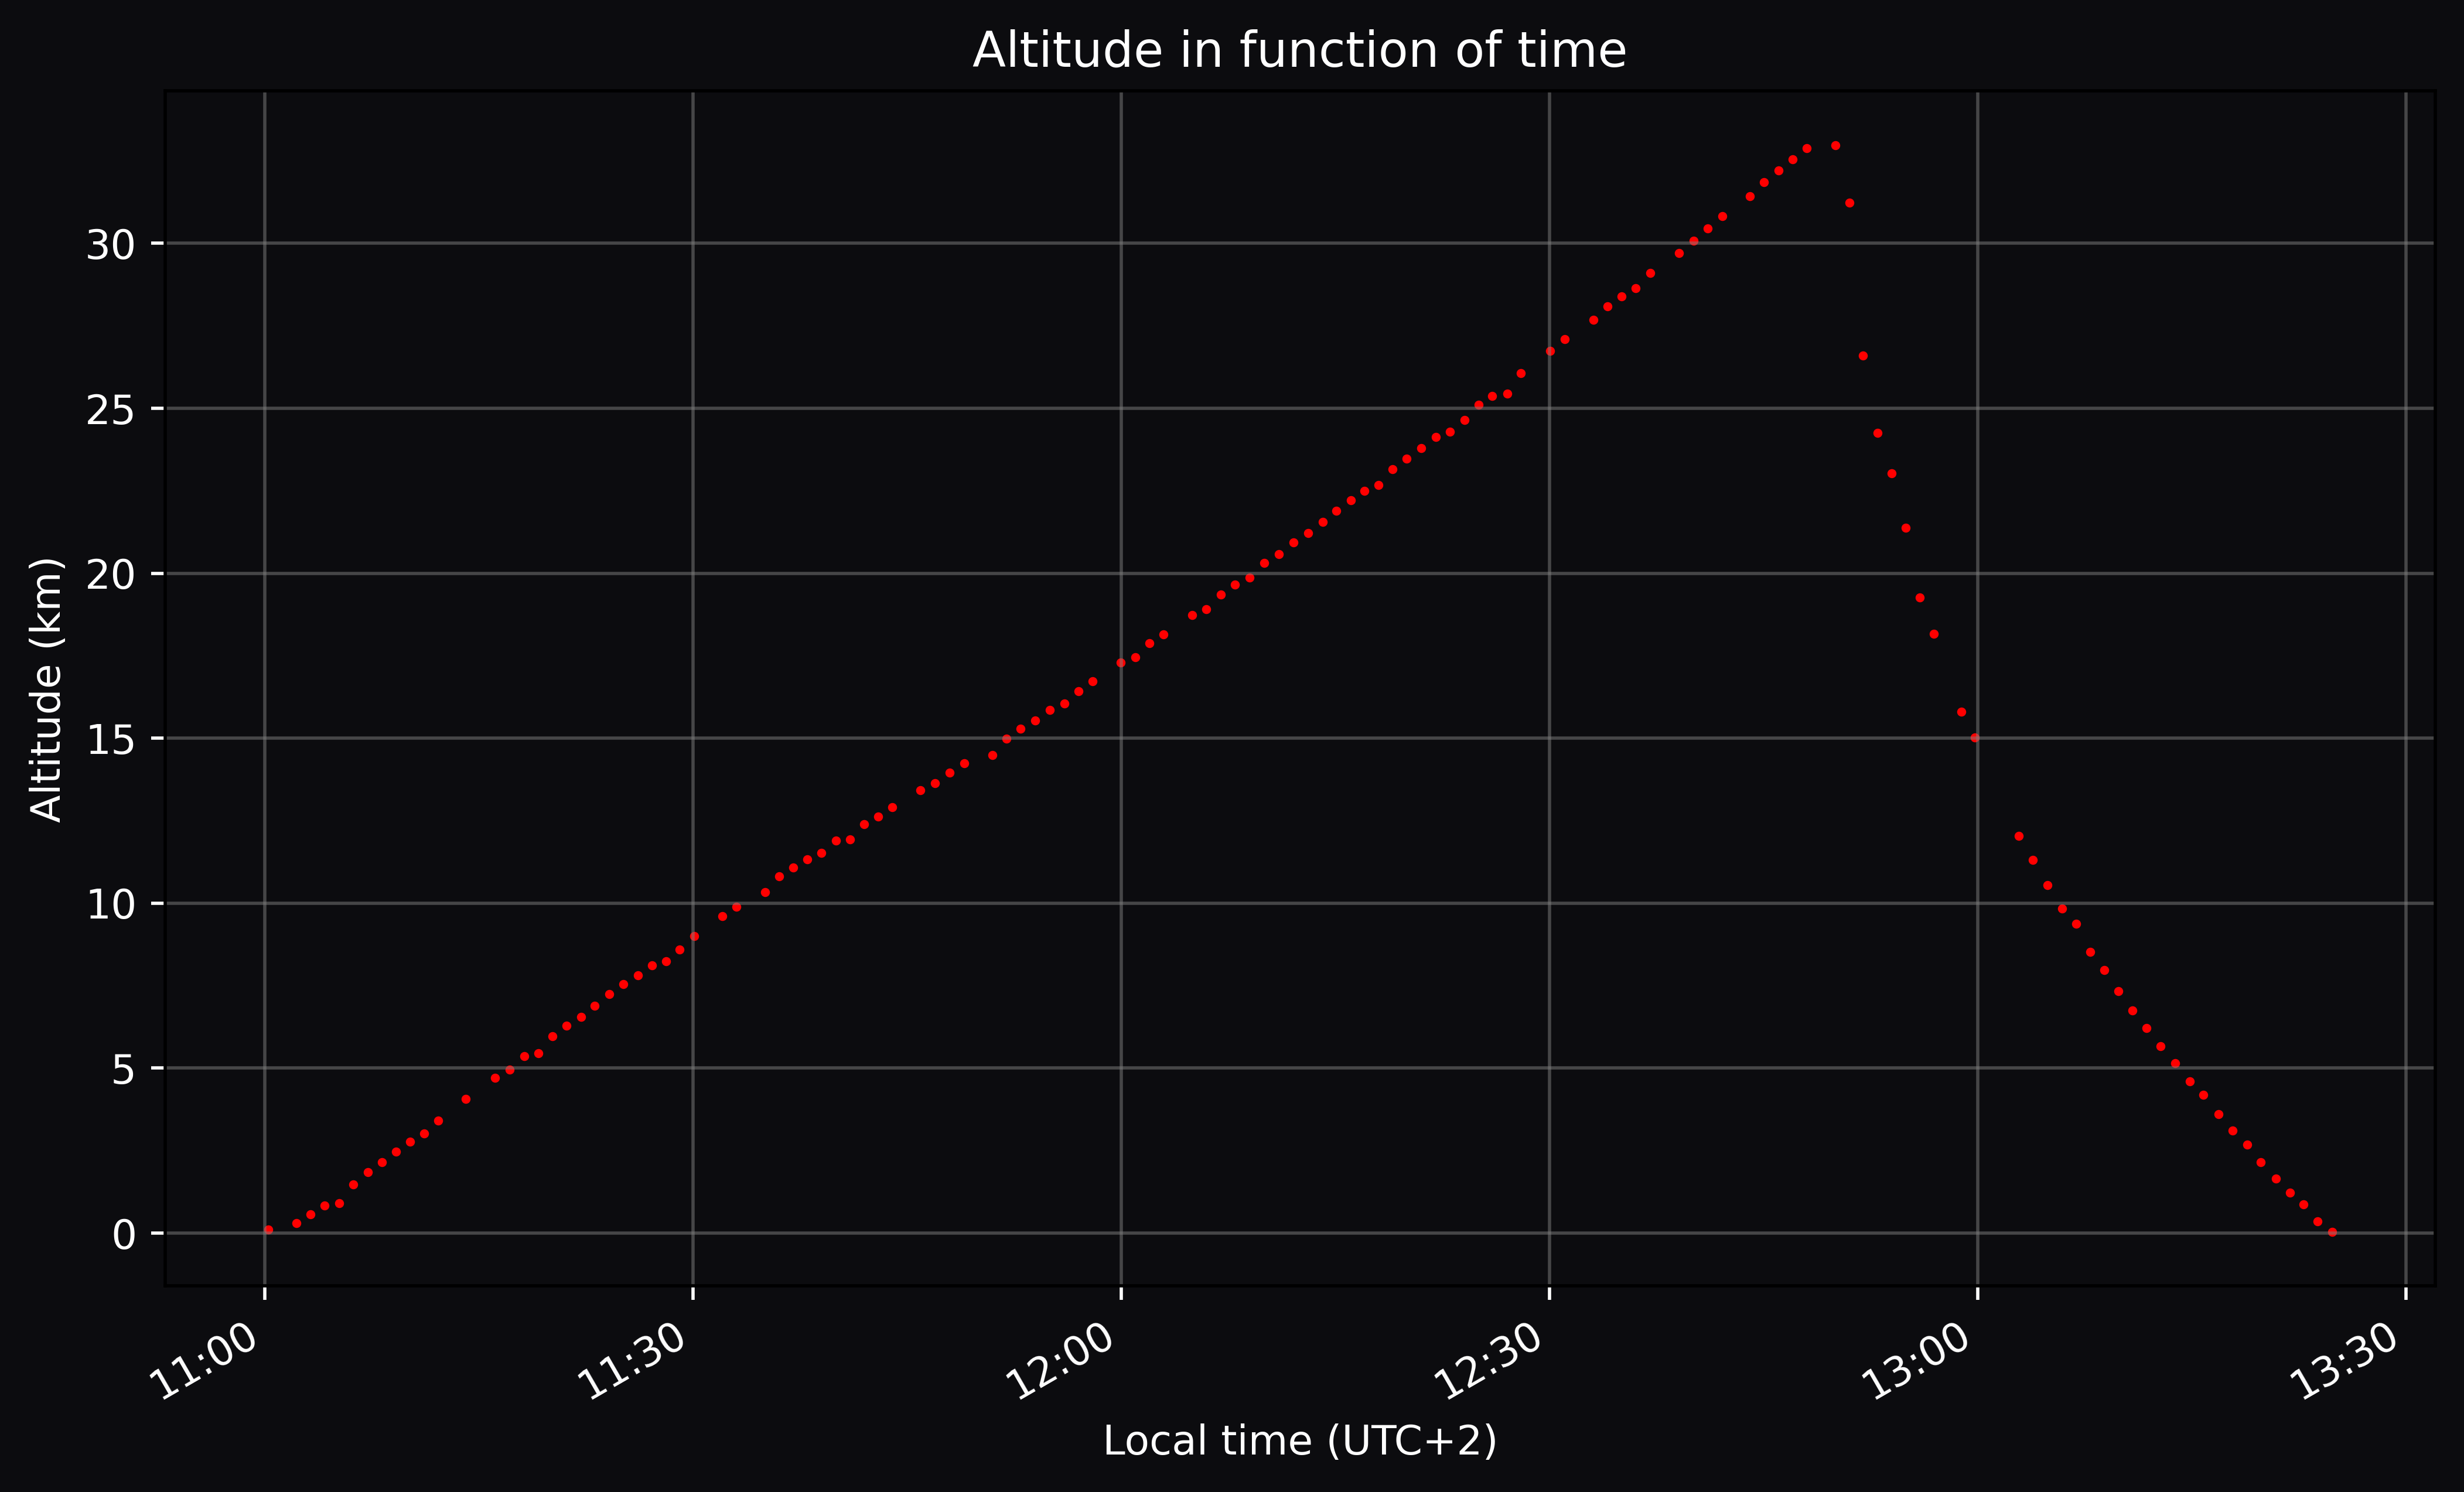
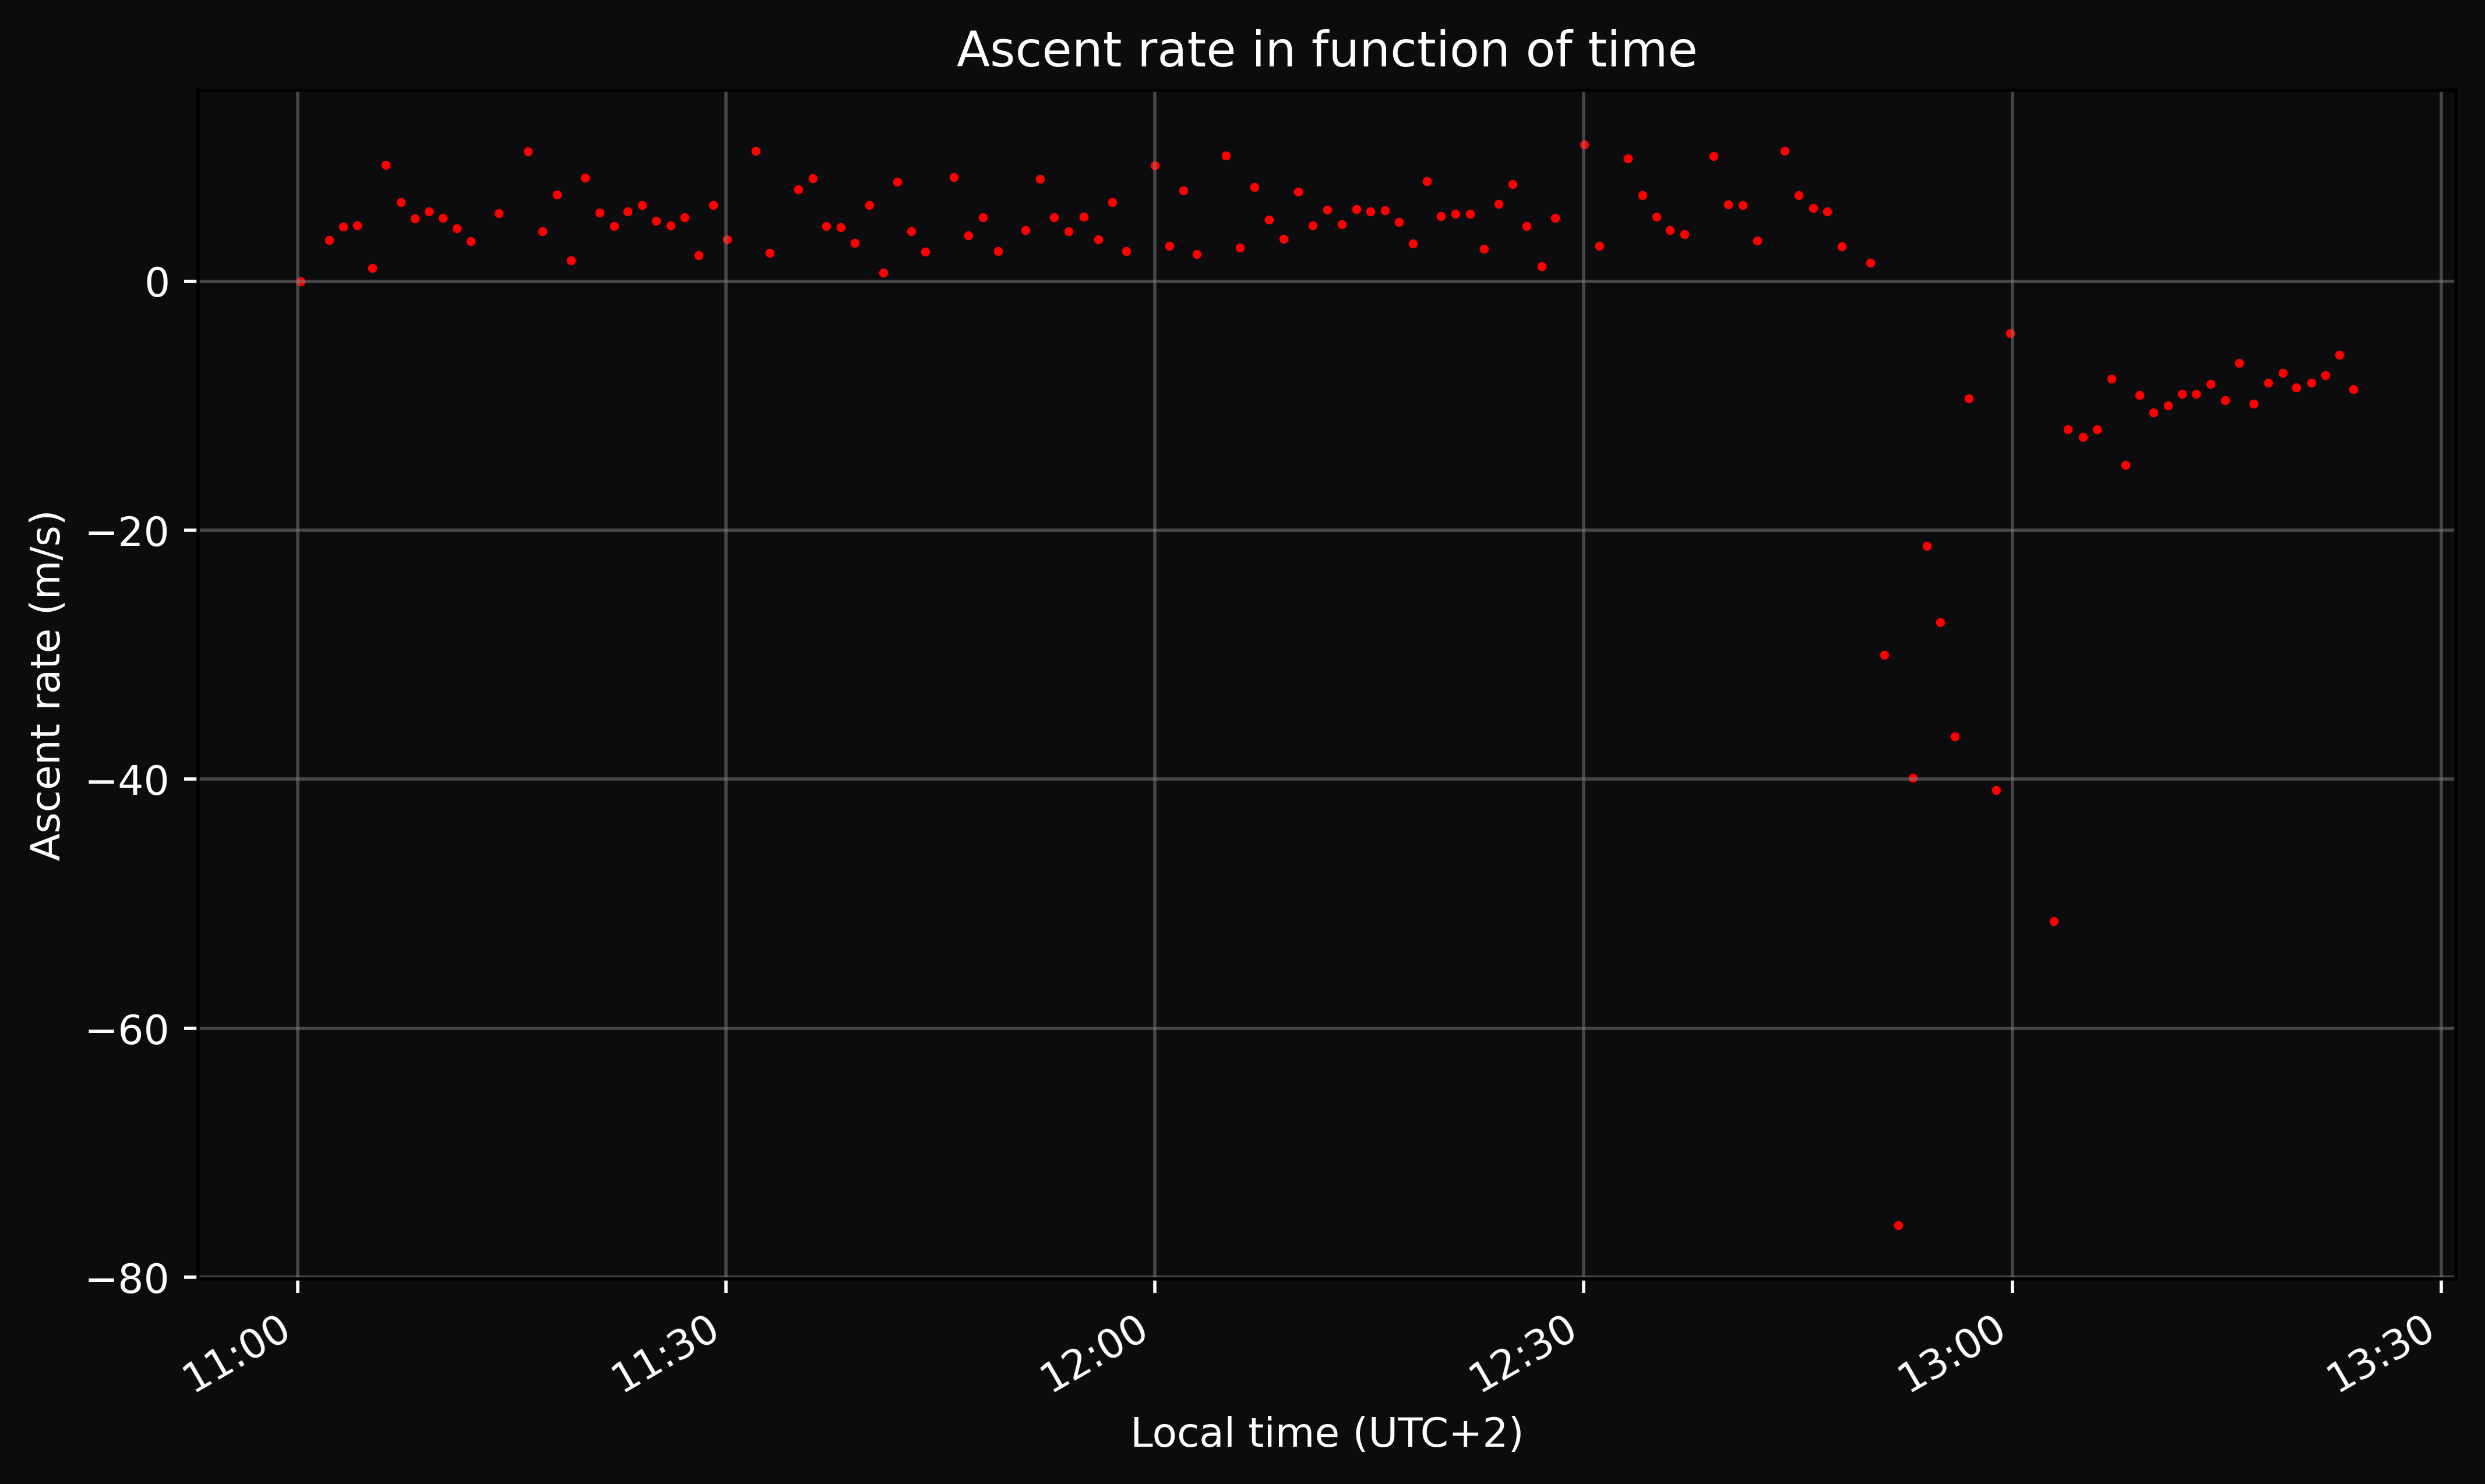
Ascent rate in time
By calculating the numerical derivative of the Altitude (h) in Time (t) data, we can determine the ascent rate as a function of time. This is only approximately true as we assume movement occurs in discrete steps.
\[v_{ascent, 1 \rightarrow 2} = \frac{h_2 - h_1}{t_2 - t_1}\]The ascent rate remains relatively constant throughout most of the balloon’s ascent before the balloon bursts and then dropping sharply near at the burst altitude. After reaching thicker regions in the atmosphere, the parachute slows down the descent.
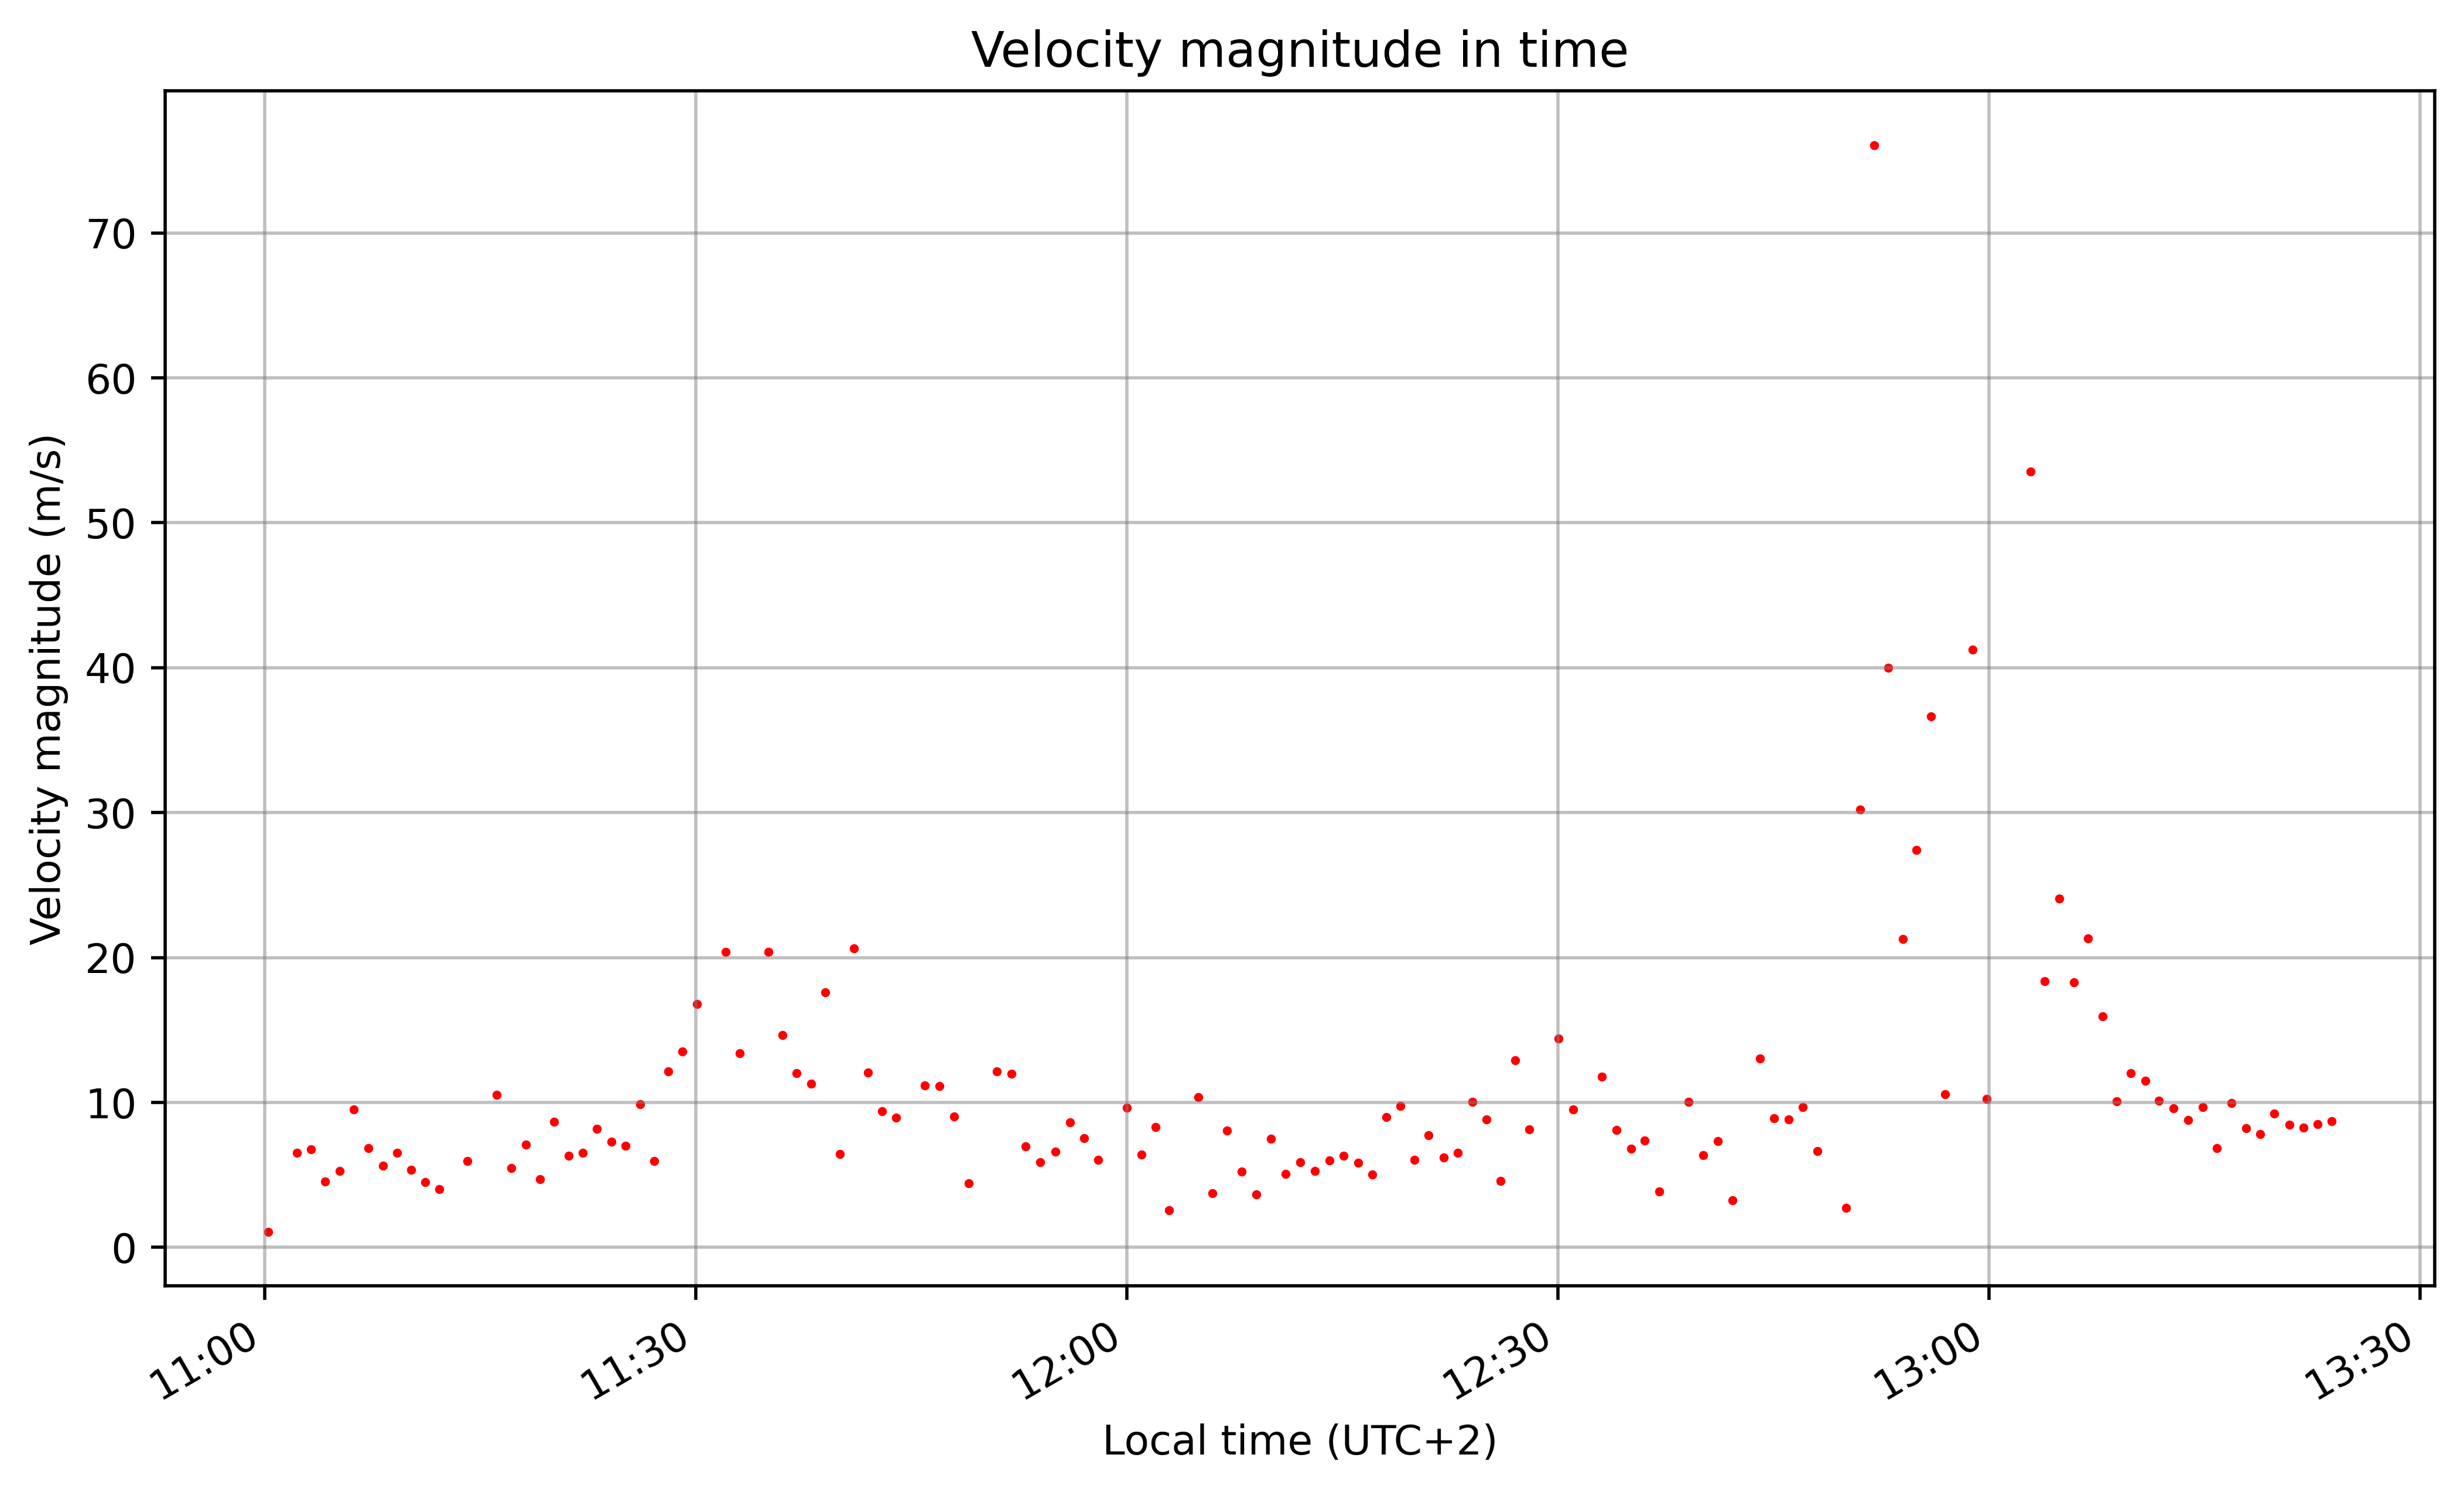
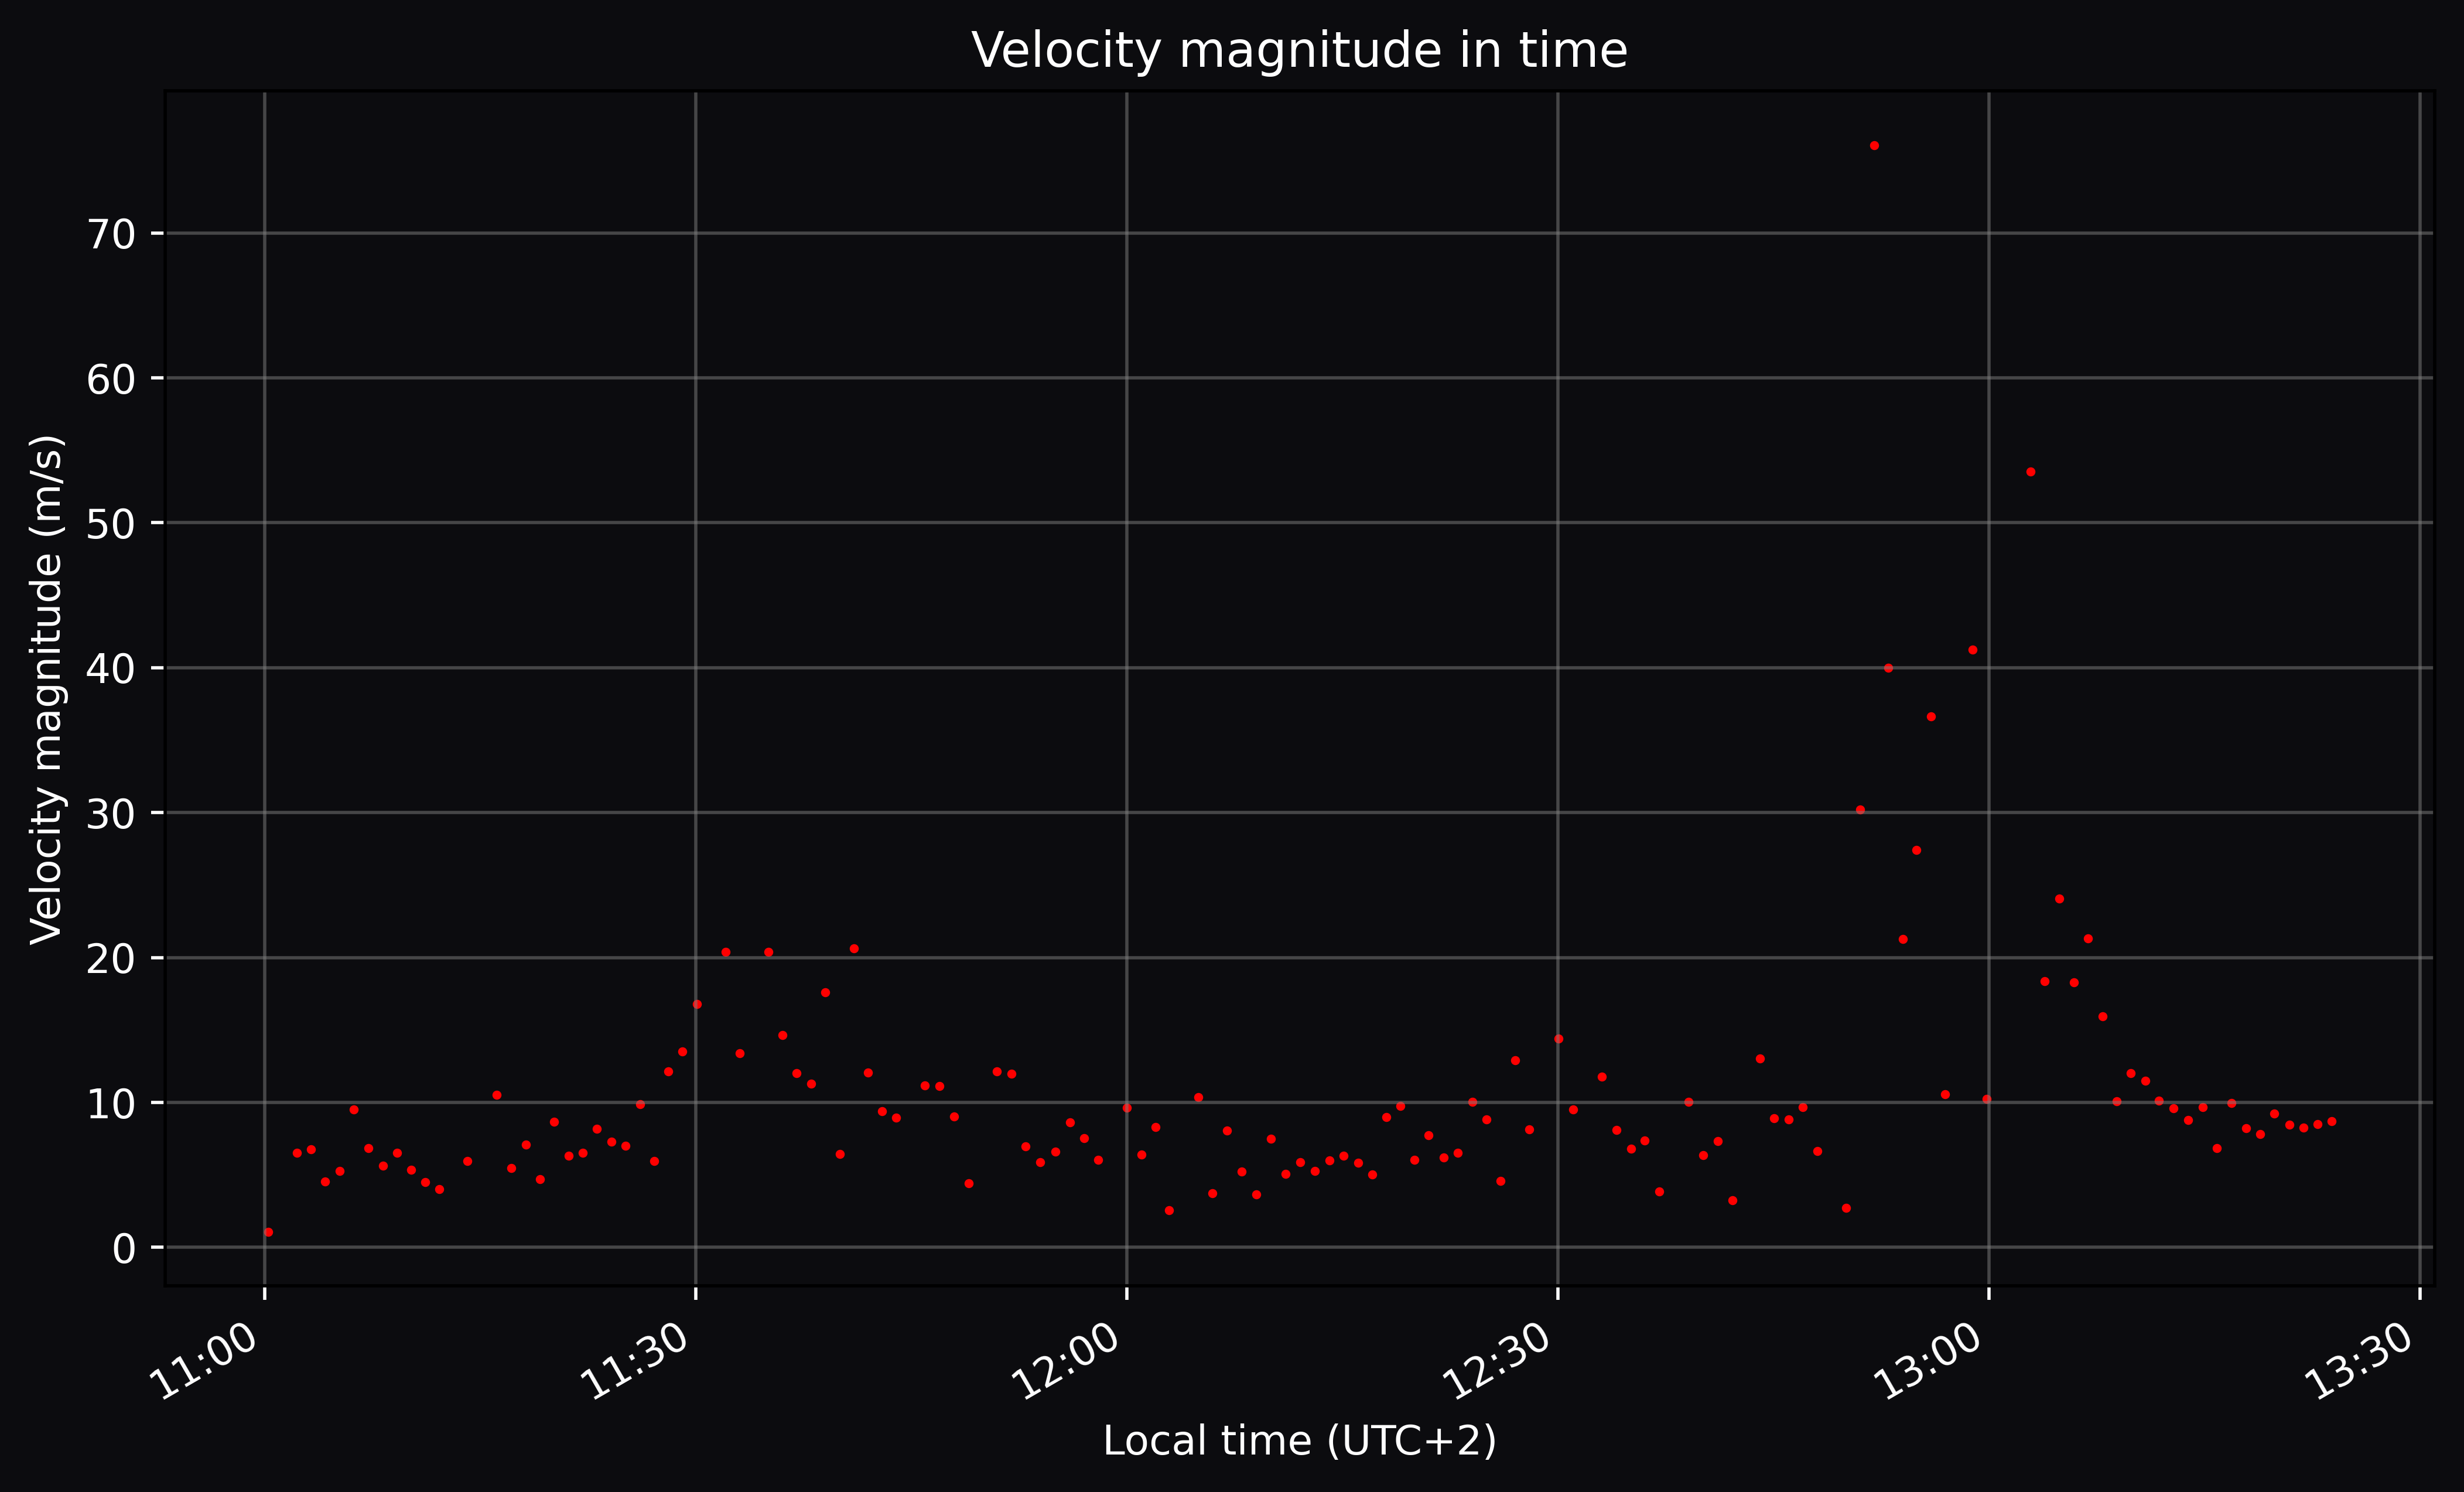
Velocity in time
Dividing the ground distance travelled by the time interval between each packet gives the ground velocity. Using the ascent rate and ground velocity, the total velocity magnitude can be calculated as:
\[v_{tot} = \sqrt{v_{gnd}^2 + v_{ascent}^2}\]Then plotting it in function of time gives the graph underneath.
Recovery
During the gondola’s flight we were continuously able to track the path and receive live sensor data. We kept driving towards the balloon’s rough location and kept close watch on the altitude to see if the balloon had burst. After noticing the altitude sharply decreasing we hypothesized that it would drift southwesterly like it had done during the initial ascent phase.
But bad luck had struck us, while consistently staying under the balloon trajectory, we got stuck in a small Walloon town just at the time children were leaving school, when we thought it couldn’t get worse there was also unloading at local Delhaize (supermarket) that blocked the only road between us and the gondola. Our excitement rose as we finally got through and neared the touchdown site, there we spotted a tangle of wire and red parachute fabric across the road. In a dramatic twist, the gondola had landed right into the middle of a dunghill (mesthoop) just off the roadside at the edge of Court-Saint-Étienne, thankfully the dunghill was already dry.
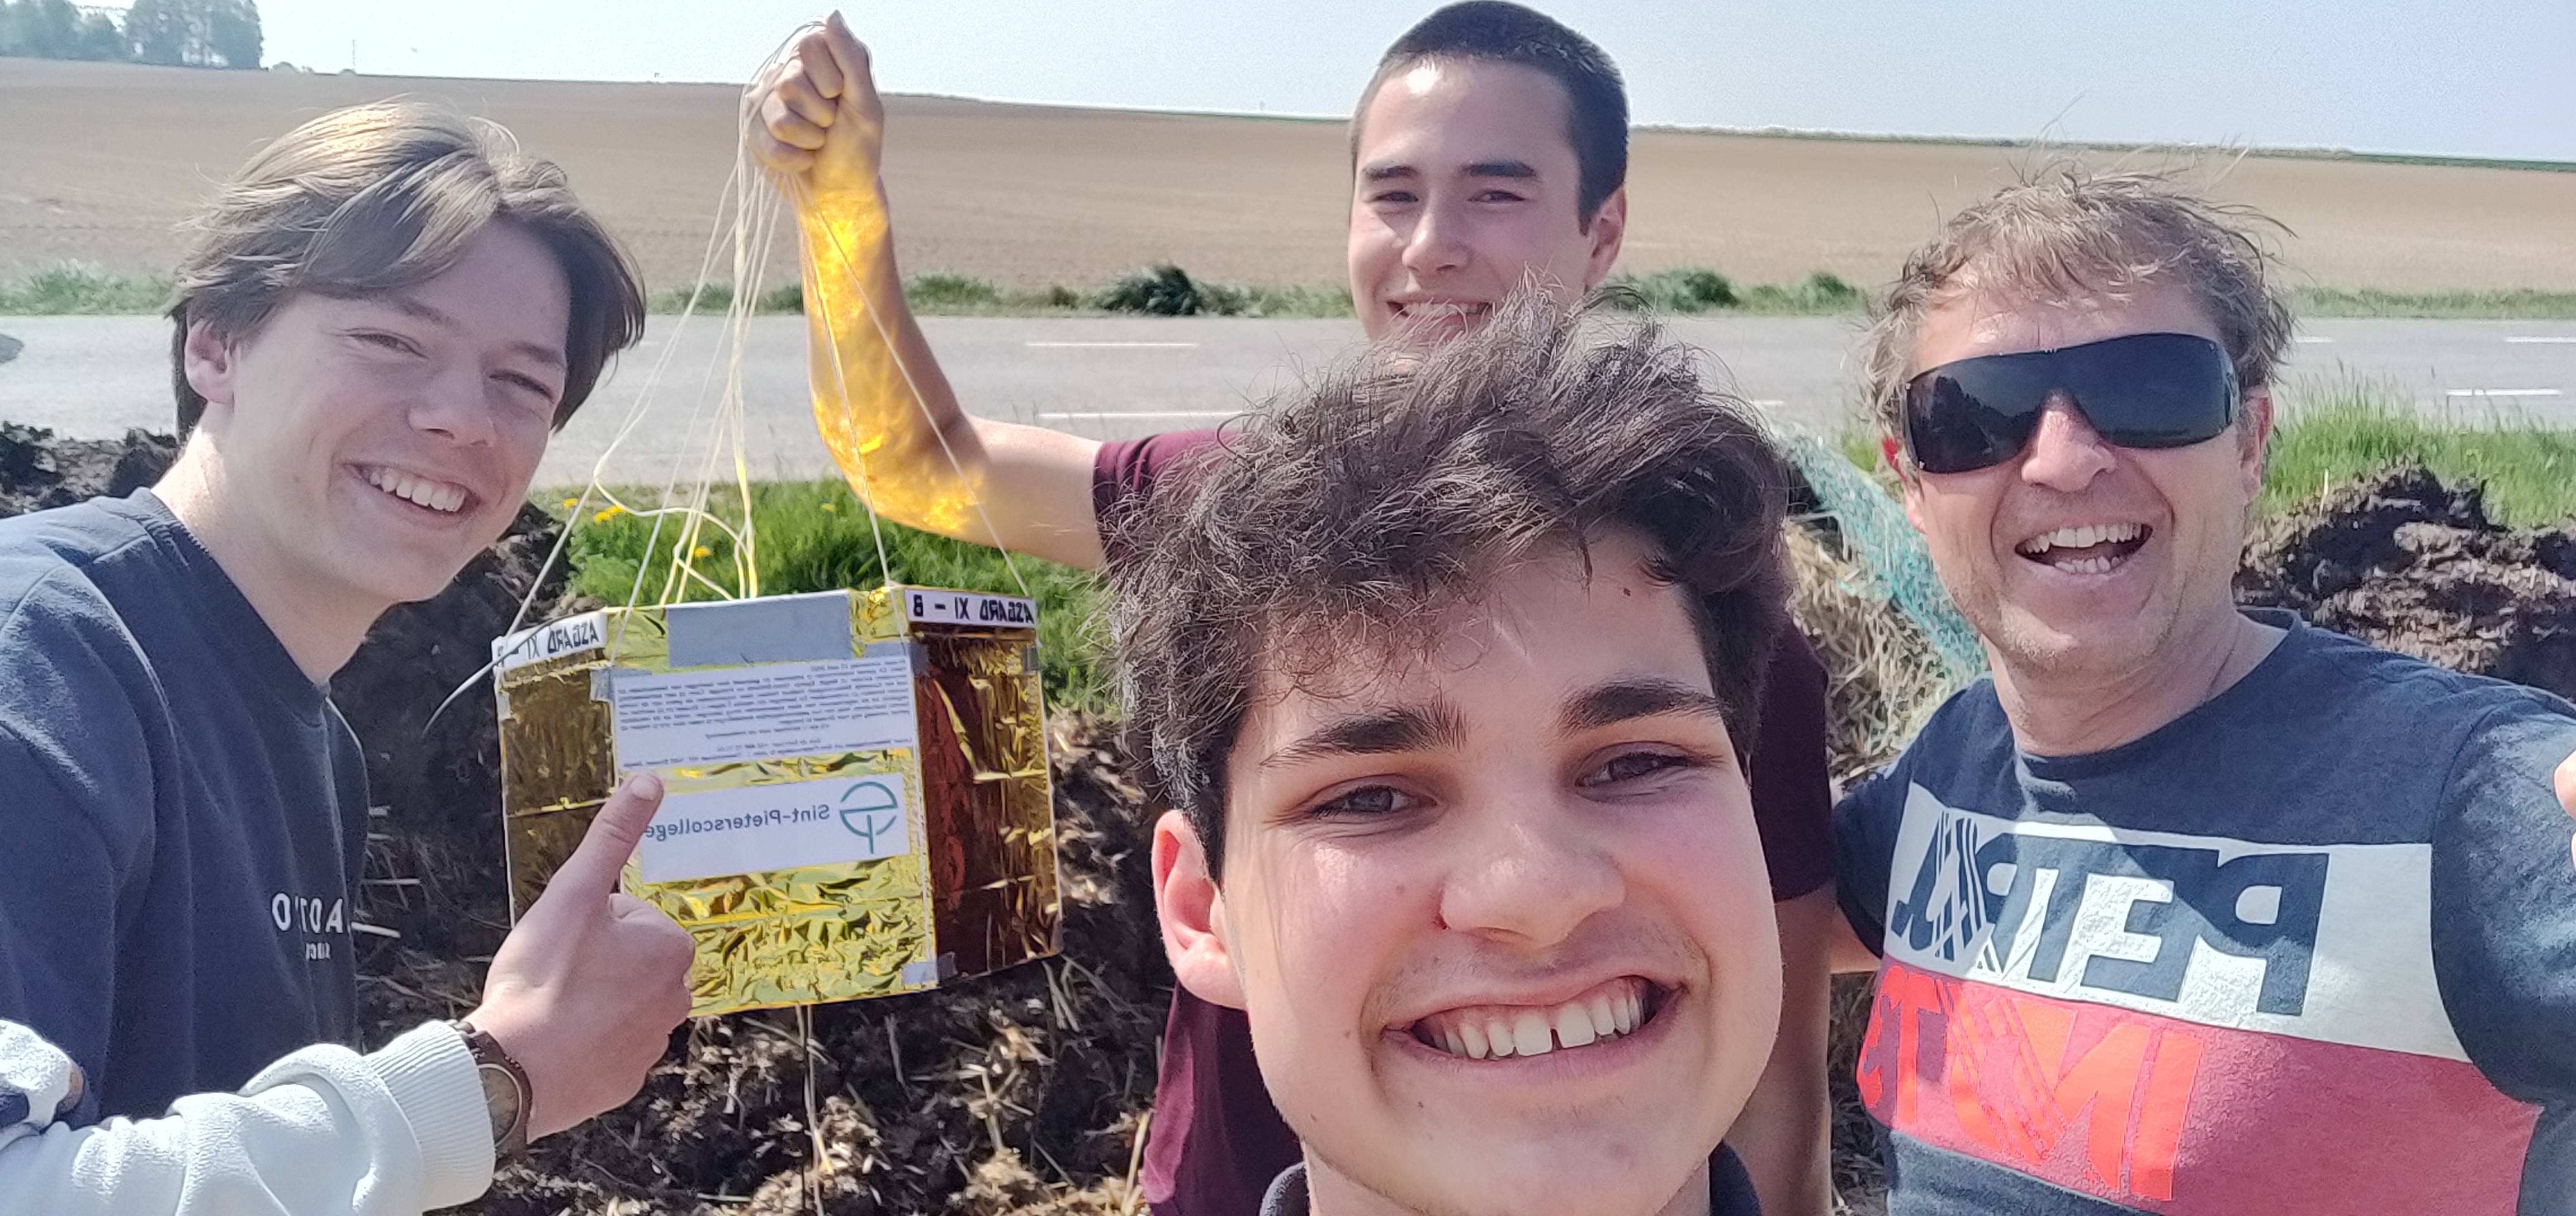 Recovery of Asgard XI gondola B in a dunghill near Court-Saint-Étienne.
Many thanks to the Royal Meteorological Observatory and Erik de Schrijver (Asgard management) for organizing this yearly balloon campaign for high-school students. Also thanks to my teammates and classmates Thomas Sondakh and Giel Swenters who made it a fun adventure.